Spaniard vs Immigrants from Somalia Divorced or Separated
COMPARE
Spaniard
Immigrants from Somalia
Divorced or Separated
Divorced or Separated Comparison
Spaniards
Immigrants from Somalia
12.7%
DIVORCED OR SEPARATED
0.2/ 100
METRIC RATING
276th/ 347
METRIC RANK
12.6%
DIVORCED OR SEPARATED
0.6/ 100
METRIC RATING
257th/ 347
METRIC RANK
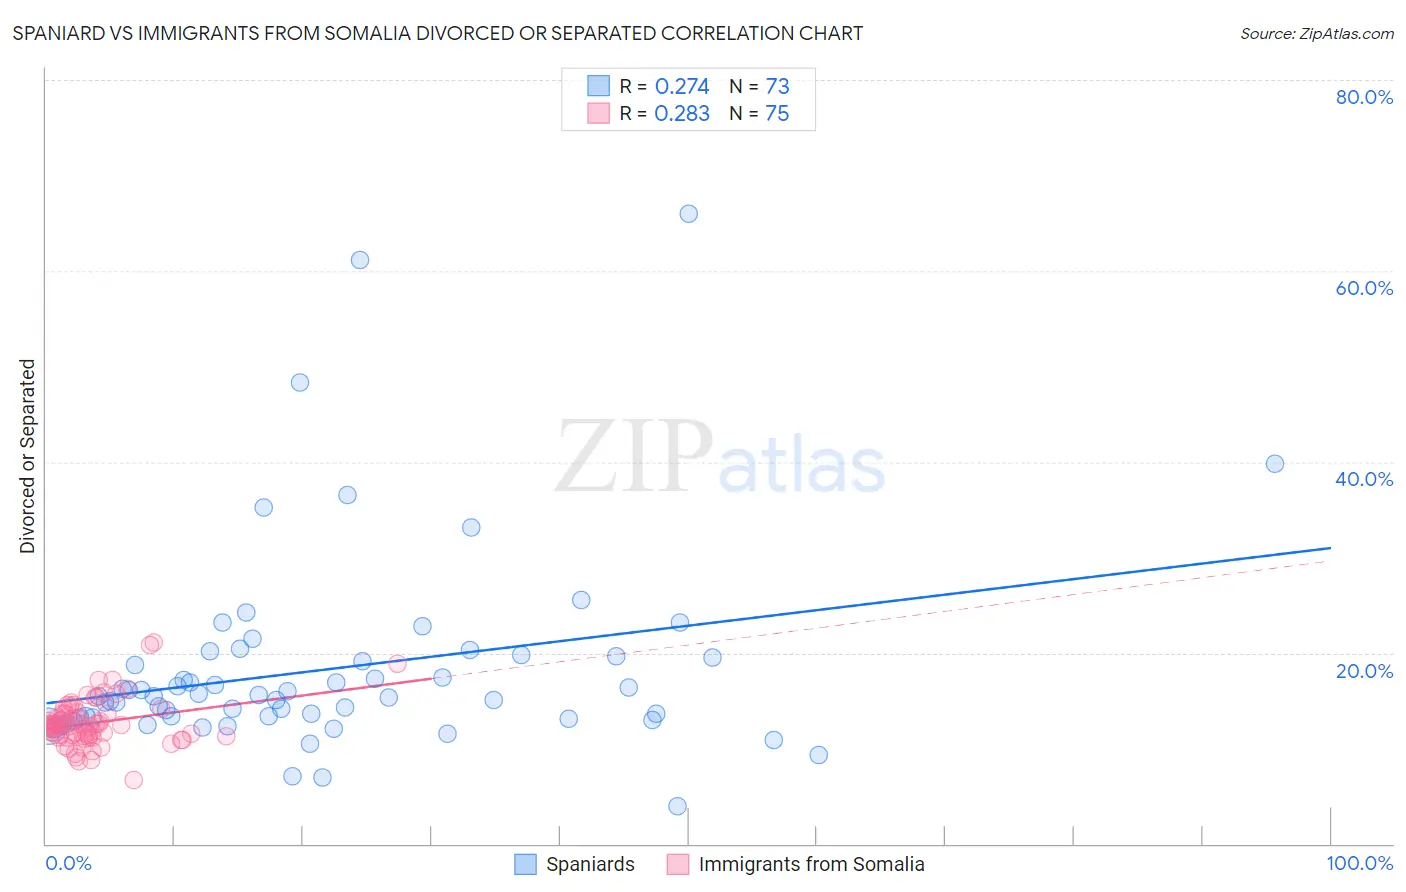
Spaniard vs Immigrants from Somalia Divorced or Separated Correlation Chart
The statistical analysis conducted on geographies consisting of 443,302,888 people shows a weak positive correlation between the proportion of Spaniards and percentage of population currently divorced or separated in the United States with a correlation coefficient (R) of 0.274 and weighted average of 12.7%. Similarly, the statistical analysis conducted on geographies consisting of 92,109,510 people shows a weak positive correlation between the proportion of Immigrants from Somalia and percentage of population currently divorced or separated in the United States with a correlation coefficient (R) of 0.283 and weighted average of 12.6%, a difference of 0.73%.
Divorced or Separated Correlation Summary
| Measurement | Spaniard | Immigrants from Somalia |
| Minimum | 3.9% | 6.7% |
| Maximum | 66.0% | 21.1% |
| Range | 62.1% | 14.4% |
| Mean | 18.3% | 12.7% |
| Median | 15.4% | 12.3% |
| Interquartile 25% (IQ1) | 13.2% | 11.3% |
| Interquartile 75% (IQ3) | 19.5% | 13.6% |
| Interquartile Range (IQR) | 6.3% | 2.3% |
| Standard Deviation (Sample) | 10.5% | 2.5% |
| Standard Deviation (Population) | 10.4% | 2.5% |
Demographics Similar to Spaniards and Immigrants from Somalia by Divorced or Separated
In terms of divorced or separated, the demographic groups most similar to Spaniards are Central American Indian (12.7%, a difference of 0.060%), Bermudan (12.7%, a difference of 0.090%), Immigrants from Micronesia (12.7%, a difference of 0.10%), Immigrants from Middle Africa (12.7%, a difference of 0.22%), and Panamanian (12.7%, a difference of 0.27%). Similarly, the demographic groups most similar to Immigrants from Somalia are Indonesian (12.6%, a difference of 0.0%), Immigrants from Colombia (12.6%, a difference of 0.010%), Yuman (12.6%, a difference of 0.020%), Immigrants from Uruguay (12.6%, a difference of 0.020%), and Immigrants from Dominica (12.6%, a difference of 0.050%).
| Demographics | Rating | Rank | Divorced or Separated |
| Immigrants | Colombia | 0.6 /100 | #256 | Tragic 12.6% |
| Immigrants | Somalia | 0.6 /100 | #257 | Tragic 12.6% |
| Indonesians | 0.6 /100 | #258 | Tragic 12.6% |
| Yuman | 0.6 /100 | #259 | Tragic 12.6% |
| Immigrants | Uruguay | 0.6 /100 | #260 | Tragic 12.6% |
| Immigrants | Dominica | 0.5 /100 | #261 | Tragic 12.6% |
| Basques | 0.5 /100 | #262 | Tragic 12.6% |
| Immigrants | Panama | 0.5 /100 | #263 | Tragic 12.6% |
| English | 0.5 /100 | #264 | Tragic 12.6% |
| Immigrants | Senegal | 0.5 /100 | #265 | Tragic 12.6% |
| Whites/Caucasians | 0.5 /100 | #266 | Tragic 12.6% |
| Scottish | 0.4 /100 | #267 | Tragic 12.6% |
| Fijians | 0.4 /100 | #268 | Tragic 12.6% |
| Immigrants | Liberia | 0.4 /100 | #269 | Tragic 12.6% |
| Ute | 0.4 /100 | #270 | Tragic 12.6% |
| Panamanians | 0.3 /100 | #271 | Tragic 12.7% |
| Immigrants | Middle Africa | 0.3 /100 | #272 | Tragic 12.7% |
| Immigrants | Micronesia | 0.3 /100 | #273 | Tragic 12.7% |
| Bermudans | 0.3 /100 | #274 | Tragic 12.7% |
| Central American Indians | 0.3 /100 | #275 | Tragic 12.7% |
| Spaniards | 0.2 /100 | #276 | Tragic 12.7% |