Immigrants from North America vs Vietnamese Births to Unmarried Women
COMPARE
Immigrants from North America
Vietnamese
Births to Unmarried Women
Births to Unmarried Women Comparison
Immigrants from North America
Vietnamese
30.6%
BIRTHS TO UNMARRIED WOMEN
81.5/ 100
METRIC RATING
145th/ 347
METRIC RANK
30.2%
BIRTHS TO UNMARRIED WOMEN
87.7/ 100
METRIC RATING
125th/ 347
METRIC RANK
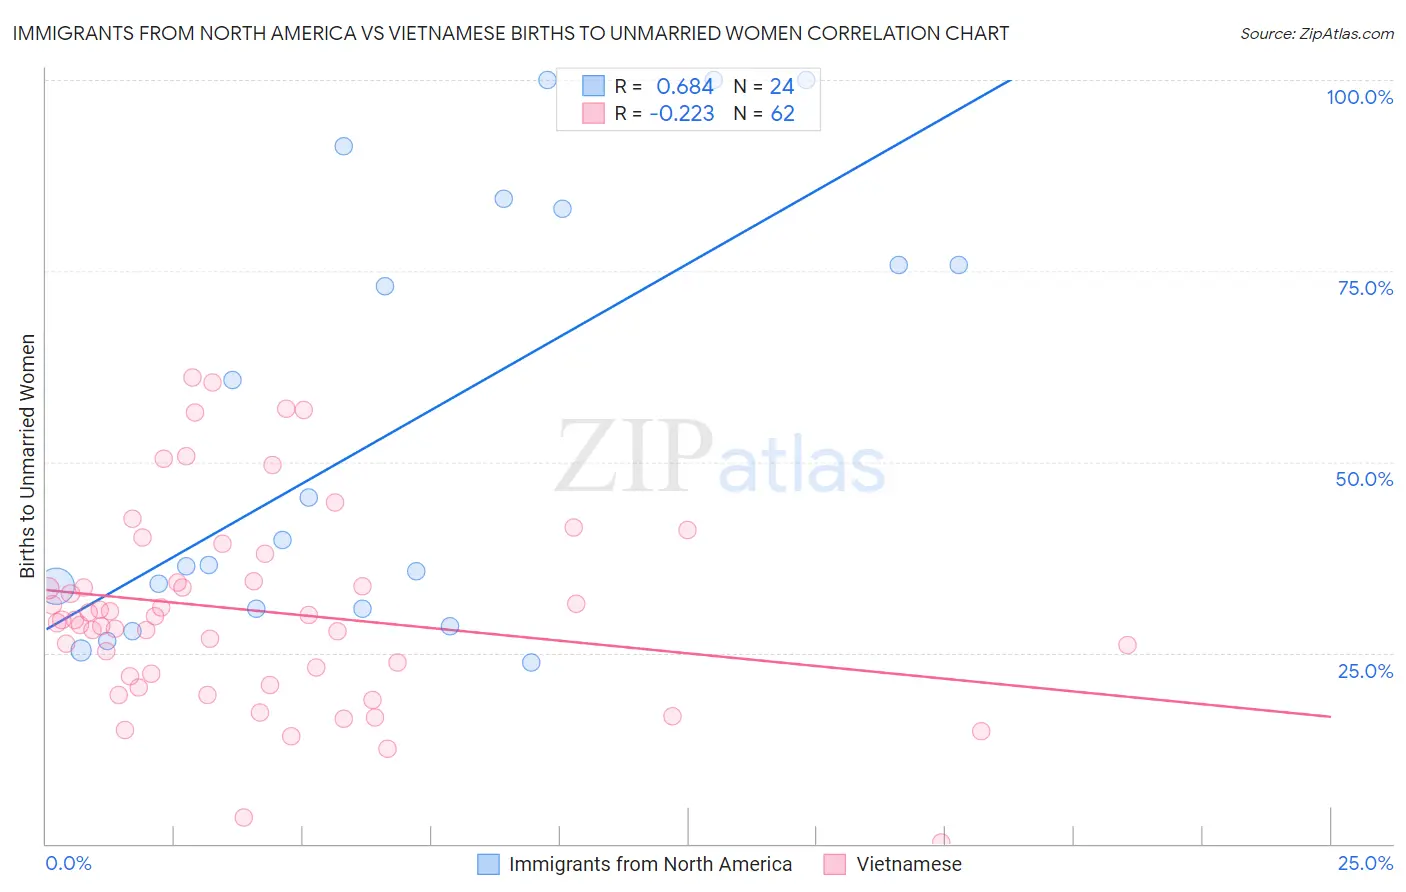
Immigrants from North America vs Vietnamese Births to Unmarried Women Correlation Chart
The statistical analysis conducted on geographies consisting of 422,623,655 people shows a significant positive correlation between the proportion of Immigrants from North America and percentage of births to unmarried women in the United States with a correlation coefficient (R) of 0.684 and weighted average of 30.6%. Similarly, the statistical analysis conducted on geographies consisting of 164,695,989 people shows a weak negative correlation between the proportion of Vietnamese and percentage of births to unmarried women in the United States with a correlation coefficient (R) of -0.223 and weighted average of 30.2%, a difference of 1.2%.
Births to Unmarried Women Correlation Summary
| Measurement | Immigrants from North America | Vietnamese |
| Minimum | 23.8% | 0.20% |
| Maximum | 100.0% | 61.1% |
| Range | 76.2% | 60.9% |
| Mean | 54.1% | 30.5% |
| Median | 38.1% | 29.3% |
| Interquartile 25% (IQ1) | 30.8% | 22.0% |
| Interquartile 75% (IQ3) | 79.4% | 34.3% |
| Interquartile Range (IQR) | 48.7% | 12.3% |
| Standard Deviation (Sample) | 27.8% | 13.0% |
| Standard Deviation (Population) | 27.2% | 12.9% |
Demographics Similar to Immigrants from North America and Vietnamese by Births to Unmarried Women
In terms of births to unmarried women, the demographic groups most similar to Immigrants from North America are Czech (30.5%, a difference of 0.10%), Immigrants from Uganda (30.5%, a difference of 0.17%), South African (30.5%, a difference of 0.19%), Pakistani (30.5%, a difference of 0.25%), and Swiss (30.5%, a difference of 0.27%). Similarly, the demographic groups most similar to Vietnamese are European (30.2%, a difference of 0.12%), Chinese (30.2%, a difference of 0.14%), Icelander (30.3%, a difference of 0.38%), Immigrants from Spain (30.3%, a difference of 0.42%), and Immigrants from Bosnia and Herzegovina (30.3%, a difference of 0.44%).
| Demographics | Rating | Rank | Births to Unmarried Women |
| Vietnamese | 87.7 /100 | #125 | Excellent 30.2% |
| Europeans | 87.2 /100 | #126 | Excellent 30.2% |
| Chinese | 87.1 /100 | #127 | Excellent 30.2% |
| Icelanders | 86.0 /100 | #128 | Excellent 30.3% |
| Immigrants | Spain | 85.8 /100 | #129 | Excellent 30.3% |
| Immigrants | Bosnia and Herzegovina | 85.7 /100 | #130 | Excellent 30.3% |
| Immigrants | Zimbabwe | 85.7 /100 | #131 | Excellent 30.3% |
| New Zealanders | 85.5 /100 | #132 | Excellent 30.3% |
| Immigrants | Morocco | 85.2 /100 | #133 | Excellent 30.4% |
| Immigrants | South Eastern Asia | 85.2 /100 | #134 | Excellent 30.4% |
| Brazilians | 84.8 /100 | #135 | Excellent 30.4% |
| Immigrants | Scotland | 84.6 /100 | #136 | Excellent 30.4% |
| Immigrants | Philippines | 83.9 /100 | #137 | Excellent 30.4% |
| Puget Sound Salish | 83.9 /100 | #138 | Excellent 30.4% |
| Immigrants | Canada | 83.7 /100 | #139 | Excellent 30.4% |
| Swiss | 83.1 /100 | #140 | Excellent 30.5% |
| Pakistanis | 83.0 /100 | #141 | Excellent 30.5% |
| South Africans | 82.7 /100 | #142 | Excellent 30.5% |
| Immigrants | Uganda | 82.6 /100 | #143 | Excellent 30.5% |
| Czechs | 82.1 /100 | #144 | Excellent 30.5% |
| Immigrants | North America | 81.5 /100 | #145 | Excellent 30.6% |