Somali vs Immigrants from Iraq Births to Unmarried Women
COMPARE
Somali
Immigrants from Iraq
Births to Unmarried Women
Births to Unmarried Women Comparison
Somalis
Immigrants from Iraq
30.7%
BIRTHS TO UNMARRIED WOMEN
77.8/ 100
METRIC RATING
150th/ 347
METRIC RANK
27.1%
BIRTHS TO UNMARRIED WOMEN
99.8/ 100
METRIC RATING
31st/ 347
METRIC RANK
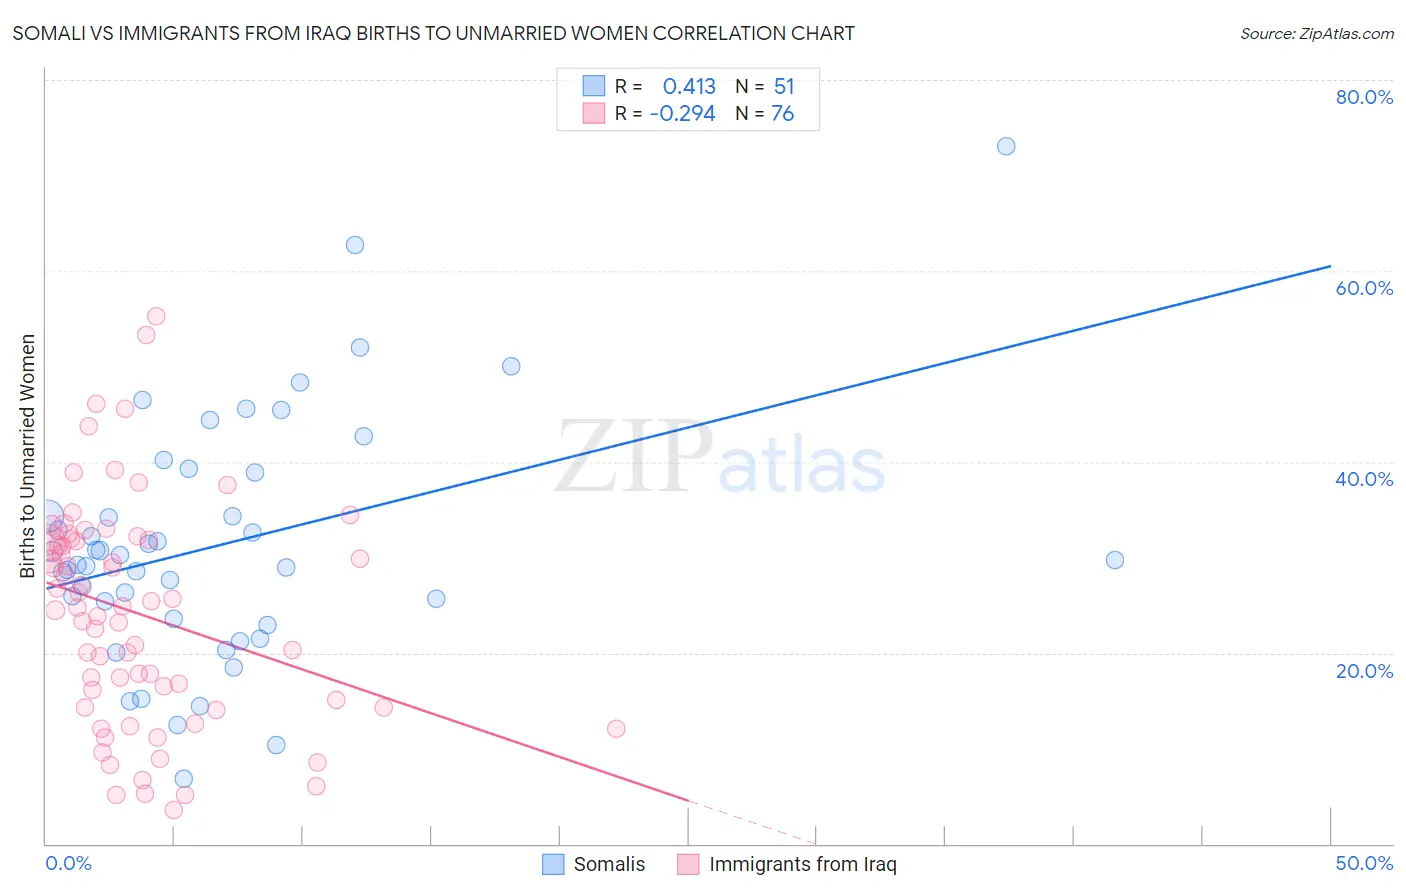
Somali vs Immigrants from Iraq Births to Unmarried Women Correlation Chart
The statistical analysis conducted on geographies consisting of 97,449,396 people shows a moderate positive correlation between the proportion of Somalis and percentage of births to unmarried women in the United States with a correlation coefficient (R) of 0.413 and weighted average of 30.7%. Similarly, the statistical analysis conducted on geographies consisting of 187,409,646 people shows a weak negative correlation between the proportion of Immigrants from Iraq and percentage of births to unmarried women in the United States with a correlation coefficient (R) of -0.294 and weighted average of 27.1%, a difference of 13.2%.
Births to Unmarried Women Correlation Summary
| Measurement | Somali | Immigrants from Iraq |
| Minimum | 6.8% | 3.6% |
| Maximum | 73.0% | 55.3% |
| Range | 66.2% | 51.7% |
| Mean | 31.3% | 24.1% |
| Median | 29.7% | 24.8% |
| Interquartile 25% (IQ1) | 23.6% | 14.6% |
| Interquartile 75% (IQ3) | 39.0% | 31.8% |
| Interquartile Range (IQR) | 15.4% | 17.1% |
| Standard Deviation (Sample) | 12.7% | 11.6% |
| Standard Deviation (Population) | 12.6% | 11.5% |
Similar Demographics by Births to Unmarried Women
Demographics Similar to Somalis by Births to Unmarried Women
In terms of births to unmarried women, the demographic groups most similar to Somalis are Italian (30.8%, a difference of 0.11%), Serbian (30.7%, a difference of 0.14%), Chilean (30.7%, a difference of 0.19%), Polish (30.8%, a difference of 0.22%), and British (30.8%, a difference of 0.24%).
| Demographics | Rating | Rank | Births to Unmarried Women |
| Immigrants | Uganda | 82.6 /100 | #143 | Excellent 30.5% |
| Czechs | 82.1 /100 | #144 | Excellent 30.5% |
| Immigrants | North America | 81.5 /100 | #145 | Excellent 30.6% |
| Northern Europeans | 81.4 /100 | #146 | Excellent 30.6% |
| Immigrants | Oceania | 81.2 /100 | #147 | Excellent 30.6% |
| Chileans | 79.1 /100 | #148 | Good 30.7% |
| Serbians | 78.8 /100 | #149 | Good 30.7% |
| Somalis | 77.8 /100 | #150 | Good 30.7% |
| Italians | 77.0 /100 | #151 | Good 30.8% |
| Poles | 76.2 /100 | #152 | Good 30.8% |
| British | 76.0 /100 | #153 | Good 30.8% |
| Yugoslavians | 75.1 /100 | #154 | Good 30.8% |
| Immigrants | Bangladesh | 73.9 /100 | #155 | Good 30.9% |
| Carpatho Rusyns | 73.5 /100 | #156 | Good 30.9% |
| Immigrants | Eastern Africa | 72.1 /100 | #157 | Good 31.0% |
Demographics Similar to Immigrants from Iraq by Births to Unmarried Women
In terms of births to unmarried women, the demographic groups most similar to Immigrants from Iraq are Immigrants from Russia (27.1%, a difference of 0.030%), Immigrants from Sri Lanka (27.2%, a difference of 0.10%), Immigrants from Pakistan (27.2%, a difference of 0.14%), Immigrants from Ireland (27.2%, a difference of 0.22%), and Bulgarian (27.1%, a difference of 0.29%).
| Demographics | Rating | Rank | Births to Unmarried Women |
| Immigrants | Australia | 99.9 /100 | #24 | Exceptional 26.6% |
| Cambodians | 99.9 /100 | #25 | Exceptional 26.7% |
| Asians | 99.9 /100 | #26 | Exceptional 26.8% |
| Immigrants | Asia | 99.9 /100 | #27 | Exceptional 26.8% |
| Okinawans | 99.8 /100 | #28 | Exceptional 26.9% |
| Cypriots | 99.8 /100 | #29 | Exceptional 27.0% |
| Bulgarians | 99.8 /100 | #30 | Exceptional 27.1% |
| Immigrants | Iraq | 99.8 /100 | #31 | Exceptional 27.1% |
| Immigrants | Russia | 99.8 /100 | #32 | Exceptional 27.1% |
| Immigrants | Sri Lanka | 99.8 /100 | #33 | Exceptional 27.2% |
| Immigrants | Pakistan | 99.8 /100 | #34 | Exceptional 27.2% |
| Immigrants | Ireland | 99.7 /100 | #35 | Exceptional 27.2% |
| Immigrants | Western Asia | 99.7 /100 | #36 | Exceptional 27.2% |
| Immigrants | Ukraine | 99.7 /100 | #37 | Exceptional 27.2% |
| Immigrants | Moldova | 99.7 /100 | #38 | Exceptional 27.3% |