Burmese vs Vietnamese Births to Unmarried Women
COMPARE
Burmese
Vietnamese
Births to Unmarried Women
Births to Unmarried Women Comparison
Burmese
Vietnamese
26.4%
BIRTHS TO UNMARRIED WOMEN
99.9/ 100
METRIC RATING
22nd/ 347
METRIC RANK
30.2%
BIRTHS TO UNMARRIED WOMEN
87.7/ 100
METRIC RATING
125th/ 347
METRIC RANK
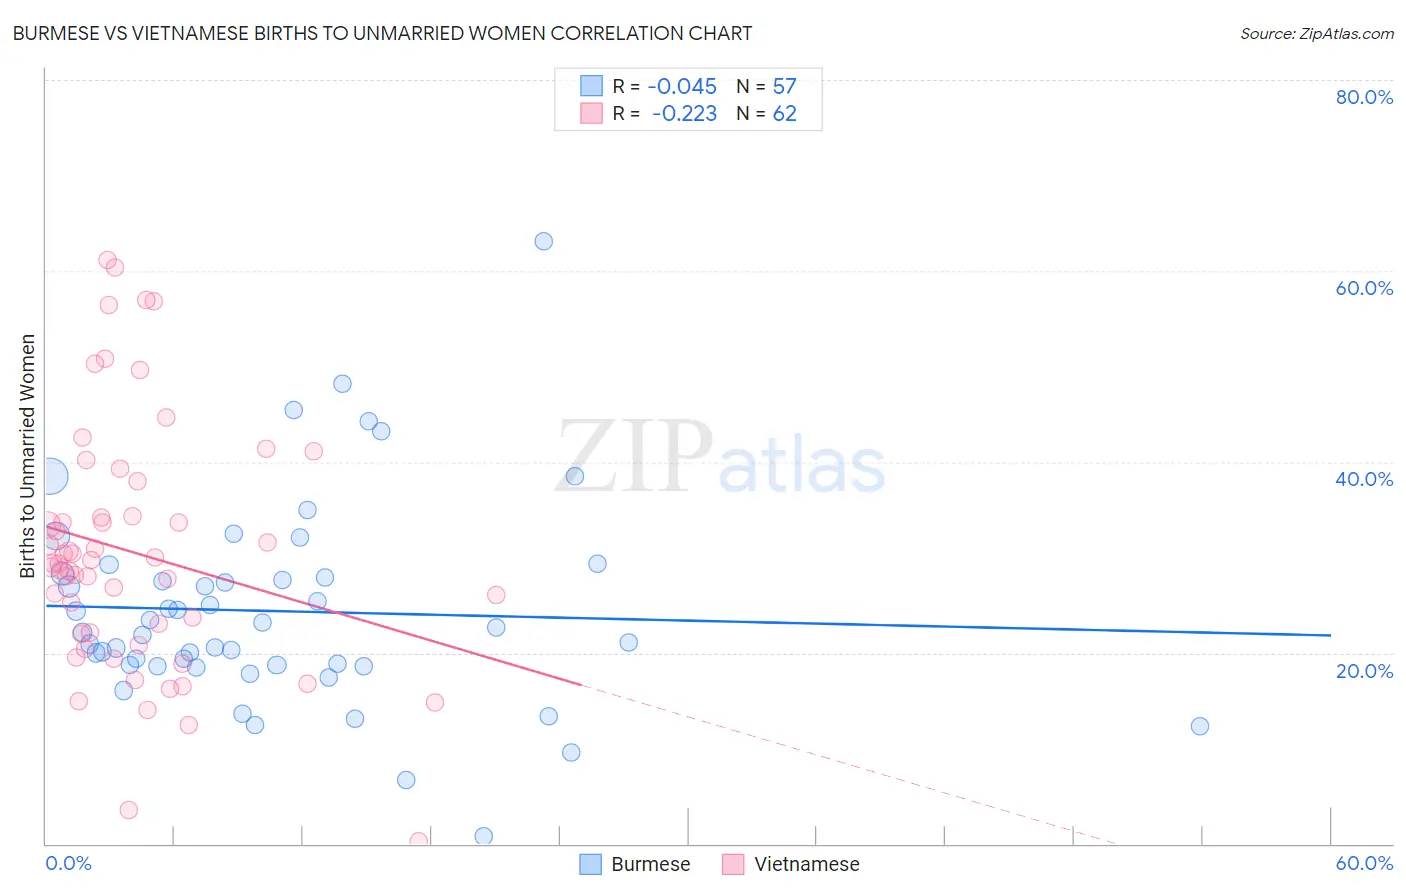
Burmese vs Vietnamese Births to Unmarried Women Correlation Chart
The statistical analysis conducted on geographies consisting of 428,519,429 people shows no correlation between the proportion of Burmese and percentage of births to unmarried women in the United States with a correlation coefficient (R) of -0.045 and weighted average of 26.4%. Similarly, the statistical analysis conducted on geographies consisting of 164,695,989 people shows a weak negative correlation between the proportion of Vietnamese and percentage of births to unmarried women in the United States with a correlation coefficient (R) of -0.223 and weighted average of 30.2%, a difference of 14.5%.
Births to Unmarried Women Correlation Summary
| Measurement | Burmese | Vietnamese |
| Minimum | 0.80% | 0.20% |
| Maximum | 63.1% | 61.1% |
| Range | 62.3% | 60.9% |
| Mean | 24.4% | 30.5% |
| Median | 22.1% | 29.3% |
| Interquartile 25% (IQ1) | 18.7% | 22.0% |
| Interquartile 75% (IQ3) | 28.1% | 34.3% |
| Interquartile Range (IQR) | 9.4% | 12.3% |
| Standard Deviation (Sample) | 10.7% | 13.0% |
| Standard Deviation (Population) | 10.6% | 12.9% |
Similar Demographics by Births to Unmarried Women
Demographics Similar to Burmese by Births to Unmarried Women
In terms of births to unmarried women, the demographic groups most similar to Burmese are Immigrants from Japan (26.4%, a difference of 0.19%), Soviet Union (26.3%, a difference of 0.22%), Immigrants from Korea (26.3%, a difference of 0.36%), Armenian (26.2%, a difference of 0.57%), and Immigrants from Australia (26.6%, a difference of 0.98%).
| Demographics | Rating | Rank | Births to Unmarried Women |
| Immigrants | Singapore | 100.0 /100 | #15 | Exceptional 25.6% |
| Immigrants | Belarus | 100.0 /100 | #16 | Exceptional 25.6% |
| Immigrants | Uzbekistan | 100.0 /100 | #17 | Exceptional 25.8% |
| Immigrants | Armenia | 99.9 /100 | #18 | Exceptional 26.1% |
| Armenians | 99.9 /100 | #19 | Exceptional 26.2% |
| Immigrants | Korea | 99.9 /100 | #20 | Exceptional 26.3% |
| Soviet Union | 99.9 /100 | #21 | Exceptional 26.3% |
| Burmese | 99.9 /100 | #22 | Exceptional 26.4% |
| Immigrants | Japan | 99.9 /100 | #23 | Exceptional 26.4% |
| Immigrants | Australia | 99.9 /100 | #24 | Exceptional 26.6% |
| Cambodians | 99.9 /100 | #25 | Exceptional 26.7% |
| Asians | 99.9 /100 | #26 | Exceptional 26.8% |
| Immigrants | Asia | 99.9 /100 | #27 | Exceptional 26.8% |
| Okinawans | 99.8 /100 | #28 | Exceptional 26.9% |
| Cypriots | 99.8 /100 | #29 | Exceptional 27.0% |
Demographics Similar to Vietnamese by Births to Unmarried Women
In terms of births to unmarried women, the demographic groups most similar to Vietnamese are Croatian (30.2%, a difference of 0.070%), Syrian (30.2%, a difference of 0.11%), European (30.2%, a difference of 0.12%), Chinese (30.2%, a difference of 0.14%), and Immigrants from Argentina (30.1%, a difference of 0.24%).
| Demographics | Rating | Rank | Births to Unmarried Women |
| Immigrants | Norway | 91.0 /100 | #118 | Exceptional 29.9% |
| Argentineans | 90.5 /100 | #119 | Exceptional 30.0% |
| Ugandans | 89.2 /100 | #120 | Excellent 30.1% |
| Koreans | 88.9 /100 | #121 | Excellent 30.1% |
| Immigrants | Argentina | 88.7 /100 | #122 | Excellent 30.1% |
| Syrians | 88.2 /100 | #123 | Excellent 30.2% |
| Croatians | 88.0 /100 | #124 | Excellent 30.2% |
| Vietnamese | 87.7 /100 | #125 | Excellent 30.2% |
| Europeans | 87.2 /100 | #126 | Excellent 30.2% |
| Chinese | 87.1 /100 | #127 | Excellent 30.2% |
| Icelanders | 86.0 /100 | #128 | Excellent 30.3% |
| Immigrants | Spain | 85.8 /100 | #129 | Excellent 30.3% |
| Immigrants | Bosnia and Herzegovina | 85.7 /100 | #130 | Excellent 30.3% |
| Immigrants | Zimbabwe | 85.7 /100 | #131 | Excellent 30.3% |
| New Zealanders | 85.5 /100 | #132 | Excellent 30.3% |