Bermudan vs Vietnamese Births to Unmarried Women
COMPARE
Bermudan
Vietnamese
Births to Unmarried Women
Births to Unmarried Women Comparison
Bermudans
Vietnamese
35.5%
BIRTHS TO UNMARRIED WOMEN
0.6/ 100
METRIC RATING
249th/ 347
METRIC RANK
30.2%
BIRTHS TO UNMARRIED WOMEN
87.7/ 100
METRIC RATING
125th/ 347
METRIC RANK
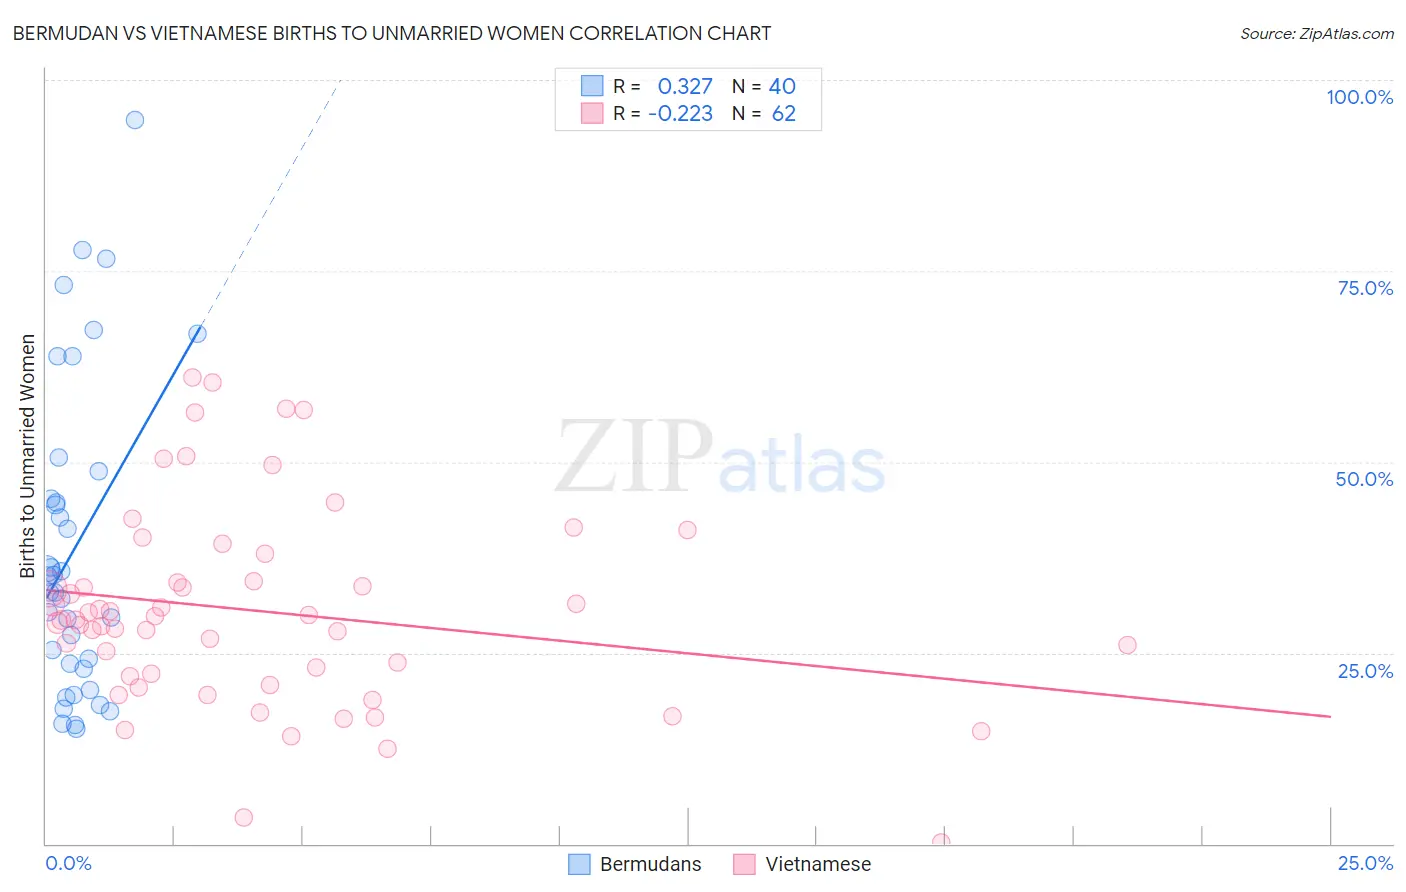
Bermudan vs Vietnamese Births to Unmarried Women Correlation Chart
The statistical analysis conducted on geographies consisting of 54,991,721 people shows a mild positive correlation between the proportion of Bermudans and percentage of births to unmarried women in the United States with a correlation coefficient (R) of 0.327 and weighted average of 35.5%. Similarly, the statistical analysis conducted on geographies consisting of 164,695,989 people shows a weak negative correlation between the proportion of Vietnamese and percentage of births to unmarried women in the United States with a correlation coefficient (R) of -0.223 and weighted average of 30.2%, a difference of 17.7%.
Births to Unmarried Women Correlation Summary
| Measurement | Bermudan | Vietnamese |
| Minimum | 15.1% | 0.20% |
| Maximum | 94.7% | 61.1% |
| Range | 79.6% | 60.9% |
| Mean | 38.7% | 30.5% |
| Median | 34.0% | 29.3% |
| Interquartile 25% (IQ1) | 23.2% | 22.0% |
| Interquartile 75% (IQ3) | 46.9% | 34.3% |
| Interquartile Range (IQR) | 23.7% | 12.3% |
| Standard Deviation (Sample) | 20.2% | 13.0% |
| Standard Deviation (Population) | 20.0% | 12.9% |
Similar Demographics by Births to Unmarried Women
Demographics Similar to Bermudans by Births to Unmarried Women
In terms of births to unmarried women, the demographic groups most similar to Bermudans are Nonimmigrants (35.5%, a difference of 0.010%), Immigrants from Nigeria (35.4%, a difference of 0.34%), Nigerian (35.3%, a difference of 0.55%), Mexican American Indian (35.7%, a difference of 0.61%), and Shoshone (35.3%, a difference of 0.66%).
| Demographics | Rating | Rank | Births to Unmarried Women |
| Indonesians | 1.2 /100 | #242 | Tragic 35.0% |
| Japanese | 0.9 /100 | #243 | Tragic 35.2% |
| Guyanese | 0.9 /100 | #244 | Tragic 35.2% |
| Shoshone | 0.8 /100 | #245 | Tragic 35.3% |
| Nigerians | 0.7 /100 | #246 | Tragic 35.3% |
| Immigrants | Nigeria | 0.7 /100 | #247 | Tragic 35.4% |
| Immigrants | Nonimmigrants | 0.6 /100 | #248 | Tragic 35.5% |
| Bermudans | 0.6 /100 | #249 | Tragic 35.5% |
| Mexican American Indians | 0.4 /100 | #250 | Tragic 35.7% |
| Immigrants | Western Africa | 0.3 /100 | #251 | Tragic 36.0% |
| Salvadorans | 0.3 /100 | #252 | Tragic 36.0% |
| Immigrants | Portugal | 0.2 /100 | #253 | Tragic 36.2% |
| Potawatomi | 0.2 /100 | #254 | Tragic 36.2% |
| Chickasaw | 0.2 /100 | #255 | Tragic 36.3% |
| Immigrants | Trinidad and Tobago | 0.2 /100 | #256 | Tragic 36.3% |
Demographics Similar to Vietnamese by Births to Unmarried Women
In terms of births to unmarried women, the demographic groups most similar to Vietnamese are Croatian (30.2%, a difference of 0.070%), Syrian (30.2%, a difference of 0.11%), European (30.2%, a difference of 0.12%), Chinese (30.2%, a difference of 0.14%), and Immigrants from Argentina (30.1%, a difference of 0.24%).
| Demographics | Rating | Rank | Births to Unmarried Women |
| Immigrants | Norway | 91.0 /100 | #118 | Exceptional 29.9% |
| Argentineans | 90.5 /100 | #119 | Exceptional 30.0% |
| Ugandans | 89.2 /100 | #120 | Excellent 30.1% |
| Koreans | 88.9 /100 | #121 | Excellent 30.1% |
| Immigrants | Argentina | 88.7 /100 | #122 | Excellent 30.1% |
| Syrians | 88.2 /100 | #123 | Excellent 30.2% |
| Croatians | 88.0 /100 | #124 | Excellent 30.2% |
| Vietnamese | 87.7 /100 | #125 | Excellent 30.2% |
| Europeans | 87.2 /100 | #126 | Excellent 30.2% |
| Chinese | 87.1 /100 | #127 | Excellent 30.2% |
| Icelanders | 86.0 /100 | #128 | Excellent 30.3% |
| Immigrants | Spain | 85.8 /100 | #129 | Excellent 30.3% |
| Immigrants | Bosnia and Herzegovina | 85.7 /100 | #130 | Excellent 30.3% |
| Immigrants | Zimbabwe | 85.7 /100 | #131 | Excellent 30.3% |
| New Zealanders | 85.5 /100 | #132 | Excellent 30.3% |