Swedish vs Vietnamese Births to Unmarried Women
COMPARE
Swedish
Vietnamese
Births to Unmarried Women
Births to Unmarried Women Comparison
Swedes
Vietnamese
29.6%
BIRTHS TO UNMARRIED WOMEN
93.8/ 100
METRIC RATING
106th/ 347
METRIC RANK
30.2%
BIRTHS TO UNMARRIED WOMEN
87.7/ 100
METRIC RATING
125th/ 347
METRIC RANK
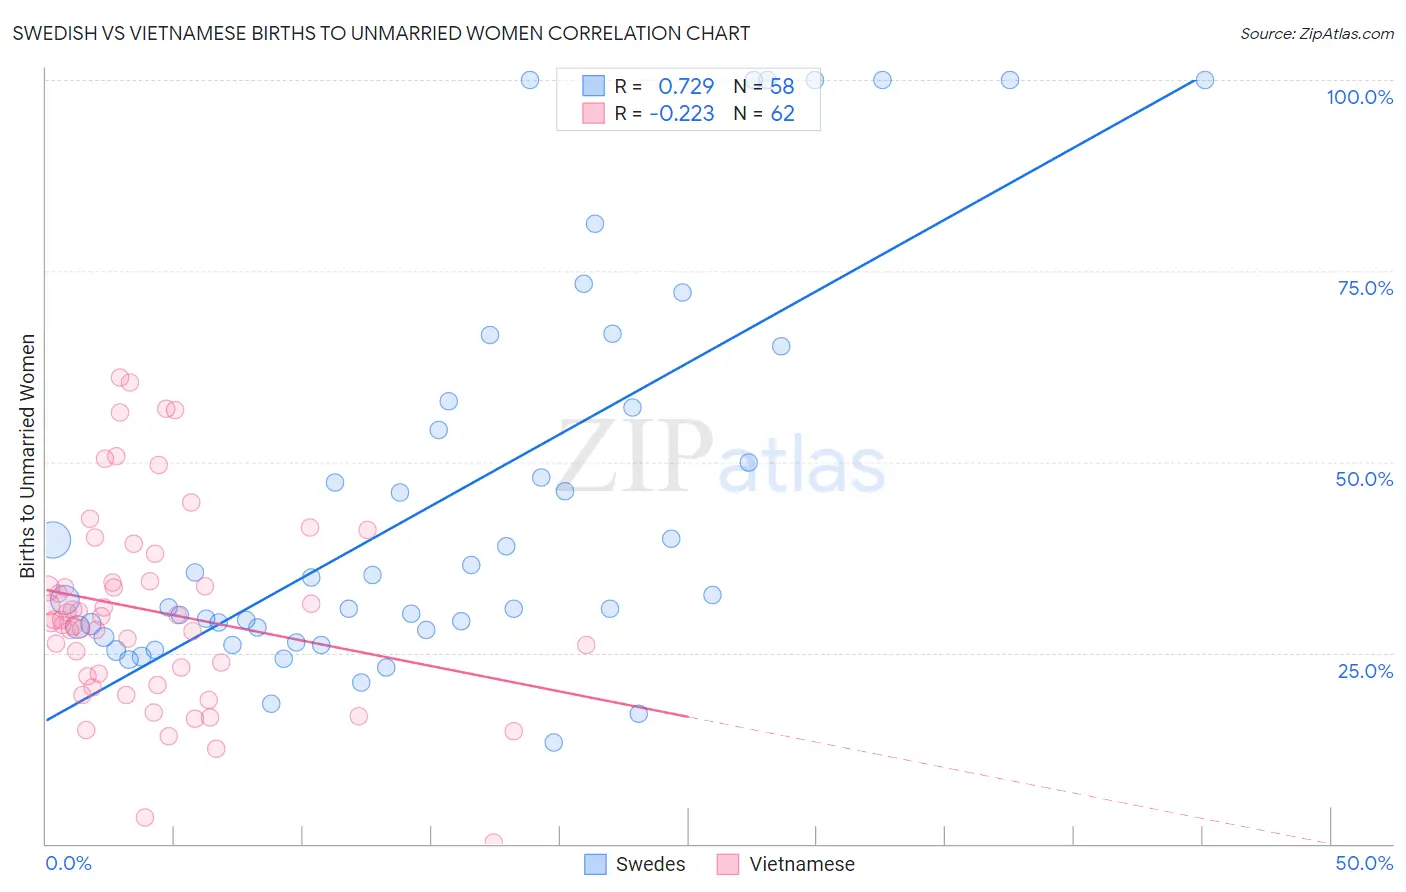
Swedish vs Vietnamese Births to Unmarried Women Correlation Chart
The statistical analysis conducted on geographies consisting of 481,429,855 people shows a strong positive correlation between the proportion of Swedes and percentage of births to unmarried women in the United States with a correlation coefficient (R) of 0.729 and weighted average of 29.6%. Similarly, the statistical analysis conducted on geographies consisting of 164,695,989 people shows a weak negative correlation between the proportion of Vietnamese and percentage of births to unmarried women in the United States with a correlation coefficient (R) of -0.223 and weighted average of 30.2%, a difference of 1.9%.
Births to Unmarried Women Correlation Summary
| Measurement | Swedish | Vietnamese |
| Minimum | 13.2% | 0.20% |
| Maximum | 100.0% | 61.1% |
| Range | 86.8% | 60.9% |
| Mean | 44.7% | 30.5% |
| Median | 32.3% | 29.3% |
| Interquartile 25% (IQ1) | 28.0% | 22.0% |
| Interquartile 75% (IQ3) | 57.1% | 34.3% |
| Interquartile Range (IQR) | 29.1% | 12.3% |
| Standard Deviation (Sample) | 25.5% | 13.0% |
| Standard Deviation (Population) | 25.2% | 12.9% |
Demographics Similar to Swedes and Vietnamese by Births to Unmarried Women
In terms of births to unmarried women, the demographic groups most similar to Swedes are Immigrants from Brazil (29.6%, a difference of 0.010%), Paraguayan (29.7%, a difference of 0.10%), Greek (29.7%, a difference of 0.14%), Immigrants from Ethiopia (29.7%, a difference of 0.17%), and Immigrants from Nepal (29.6%, a difference of 0.25%). Similarly, the demographic groups most similar to Vietnamese are Croatian (30.2%, a difference of 0.070%), Syrian (30.2%, a difference of 0.11%), Immigrants from Argentina (30.1%, a difference of 0.24%), Korean (30.1%, a difference of 0.28%), and Ugandan (30.1%, a difference of 0.36%).
| Demographics | Rating | Rank | Births to Unmarried Women |
| Immigrants | Nepal | 94.3 /100 | #105 | Exceptional 29.6% |
| Swedes | 93.8 /100 | #106 | Exceptional 29.6% |
| Immigrants | Brazil | 93.7 /100 | #107 | Exceptional 29.6% |
| Paraguayans | 93.5 /100 | #108 | Exceptional 29.7% |
| Greeks | 93.4 /100 | #109 | Exceptional 29.7% |
| Immigrants | Ethiopia | 93.4 /100 | #110 | Exceptional 29.7% |
| Immigrants | Hungary | 93.0 /100 | #111 | Exceptional 29.7% |
| Basques | 93.0 /100 | #112 | Exceptional 29.7% |
| Scandinavians | 92.7 /100 | #113 | Exceptional 29.8% |
| Immigrants | Croatia | 92.6 /100 | #114 | Exceptional 29.8% |
| Ethiopians | 91.9 /100 | #115 | Exceptional 29.8% |
| Immigrants | Italy | 91.7 /100 | #116 | Exceptional 29.9% |
| Immigrants | Netherlands | 91.1 /100 | #117 | Exceptional 29.9% |
| Immigrants | Norway | 91.0 /100 | #118 | Exceptional 29.9% |
| Argentineans | 90.5 /100 | #119 | Exceptional 30.0% |
| Ugandans | 89.2 /100 | #120 | Excellent 30.1% |
| Koreans | 88.9 /100 | #121 | Excellent 30.1% |
| Immigrants | Argentina | 88.7 /100 | #122 | Excellent 30.1% |
| Syrians | 88.2 /100 | #123 | Excellent 30.2% |
| Croatians | 88.0 /100 | #124 | Excellent 30.2% |
| Vietnamese | 87.7 /100 | #125 | Excellent 30.2% |