Somali vs Immigrants from Uzbekistan Births to Unmarried Women
COMPARE
Somali
Immigrants from Uzbekistan
Births to Unmarried Women
Births to Unmarried Women Comparison
Somalis
Immigrants from Uzbekistan
30.7%
BIRTHS TO UNMARRIED WOMEN
77.8/ 100
METRIC RATING
150th/ 347
METRIC RANK
25.8%
BIRTHS TO UNMARRIED WOMEN
100.0/ 100
METRIC RATING
17th/ 347
METRIC RANK
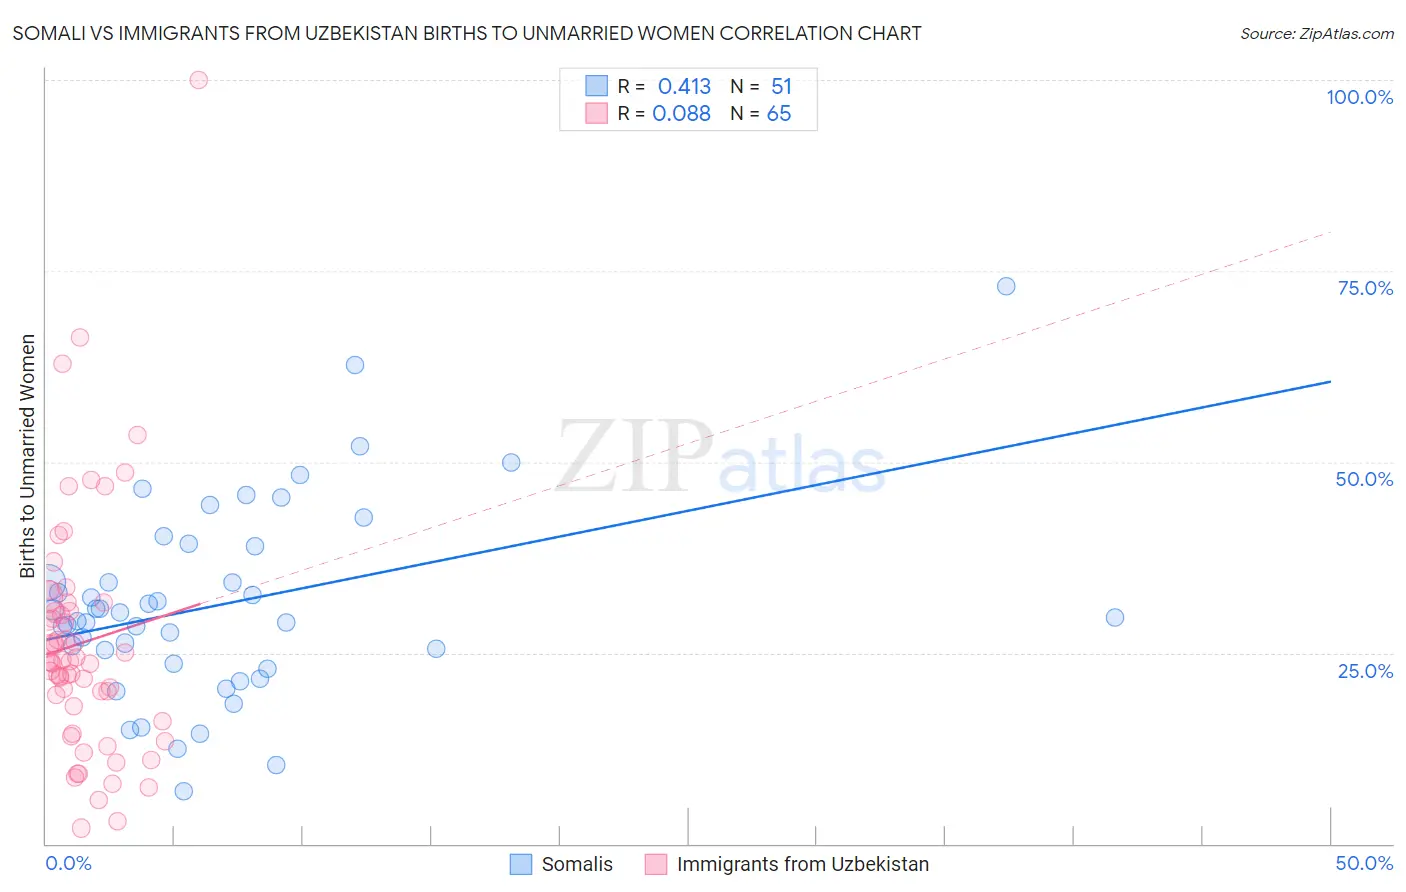
Somali vs Immigrants from Uzbekistan Births to Unmarried Women Correlation Chart
The statistical analysis conducted on geographies consisting of 97,449,396 people shows a moderate positive correlation between the proportion of Somalis and percentage of births to unmarried women in the United States with a correlation coefficient (R) of 0.413 and weighted average of 30.7%. Similarly, the statistical analysis conducted on geographies consisting of 114,110,355 people shows a slight positive correlation between the proportion of Immigrants from Uzbekistan and percentage of births to unmarried women in the United States with a correlation coefficient (R) of 0.088 and weighted average of 25.8%, a difference of 19.2%.
Births to Unmarried Women Correlation Summary
| Measurement | Somali | Immigrants from Uzbekistan |
| Minimum | 6.8% | 2.0% |
| Maximum | 73.0% | 100.0% |
| Range | 66.2% | 98.0% |
| Mean | 31.3% | 26.3% |
| Median | 29.7% | 23.9% |
| Interquartile 25% (IQ1) | 23.6% | 17.0% |
| Interquartile 75% (IQ3) | 39.0% | 31.0% |
| Interquartile Range (IQR) | 15.4% | 14.0% |
| Standard Deviation (Sample) | 12.7% | 16.2% |
| Standard Deviation (Population) | 12.6% | 16.0% |
Similar Demographics by Births to Unmarried Women
Demographics Similar to Somalis by Births to Unmarried Women
In terms of births to unmarried women, the demographic groups most similar to Somalis are Italian (30.8%, a difference of 0.11%), Serbian (30.7%, a difference of 0.14%), Chilean (30.7%, a difference of 0.19%), Polish (30.8%, a difference of 0.22%), and British (30.8%, a difference of 0.24%).
| Demographics | Rating | Rank | Births to Unmarried Women |
| Immigrants | Uganda | 82.6 /100 | #143 | Excellent 30.5% |
| Czechs | 82.1 /100 | #144 | Excellent 30.5% |
| Immigrants | North America | 81.5 /100 | #145 | Excellent 30.6% |
| Northern Europeans | 81.4 /100 | #146 | Excellent 30.6% |
| Immigrants | Oceania | 81.2 /100 | #147 | Excellent 30.6% |
| Chileans | 79.1 /100 | #148 | Good 30.7% |
| Serbians | 78.8 /100 | #149 | Good 30.7% |
| Somalis | 77.8 /100 | #150 | Good 30.7% |
| Italians | 77.0 /100 | #151 | Good 30.8% |
| Poles | 76.2 /100 | #152 | Good 30.8% |
| British | 76.0 /100 | #153 | Good 30.8% |
| Yugoslavians | 75.1 /100 | #154 | Good 30.8% |
| Immigrants | Bangladesh | 73.9 /100 | #155 | Good 30.9% |
| Carpatho Rusyns | 73.5 /100 | #156 | Good 30.9% |
| Immigrants | Eastern Africa | 72.1 /100 | #157 | Good 31.0% |
Demographics Similar to Immigrants from Uzbekistan by Births to Unmarried Women
In terms of births to unmarried women, the demographic groups most similar to Immigrants from Uzbekistan are Immigrants from Belarus (25.6%, a difference of 0.57%), Immigrants from Singapore (25.6%, a difference of 0.62%), Immigrants from Armenia (26.1%, a difference of 1.1%), Armenian (26.2%, a difference of 1.7%), and Immigrants from Lebanon (25.3%, a difference of 1.8%).
| Demographics | Rating | Rank | Births to Unmarried Women |
| Immigrants | Eastern Asia | 100.0 /100 | #10 | Exceptional 25.0% |
| Immigrants | Israel | 100.0 /100 | #11 | Exceptional 25.1% |
| Indians (Asian) | 100.0 /100 | #12 | Exceptional 25.3% |
| Iranians | 100.0 /100 | #13 | Exceptional 25.3% |
| Immigrants | Lebanon | 100.0 /100 | #14 | Exceptional 25.3% |
| Immigrants | Singapore | 100.0 /100 | #15 | Exceptional 25.6% |
| Immigrants | Belarus | 100.0 /100 | #16 | Exceptional 25.6% |
| Immigrants | Uzbekistan | 100.0 /100 | #17 | Exceptional 25.8% |
| Immigrants | Armenia | 99.9 /100 | #18 | Exceptional 26.1% |
| Armenians | 99.9 /100 | #19 | Exceptional 26.2% |
| Immigrants | Korea | 99.9 /100 | #20 | Exceptional 26.3% |
| Soviet Union | 99.9 /100 | #21 | Exceptional 26.3% |
| Burmese | 99.9 /100 | #22 | Exceptional 26.4% |
| Immigrants | Japan | 99.9 /100 | #23 | Exceptional 26.4% |
| Immigrants | Australia | 99.9 /100 | #24 | Exceptional 26.6% |