Somali vs Immigrants from Guyana Average Family Size
COMPARE
Somali
Immigrants from Guyana
Average Family Size
Average Family Size Comparison
Somalis
Immigrants from Guyana
3.20
AVERAGE FAMILY SIZE
11.2/ 100
METRIC RATING
214th/ 347
METRIC RANK
3.40
AVERAGE FAMILY SIZE
100.0/ 100
METRIC RATING
36th/ 347
METRIC RANK
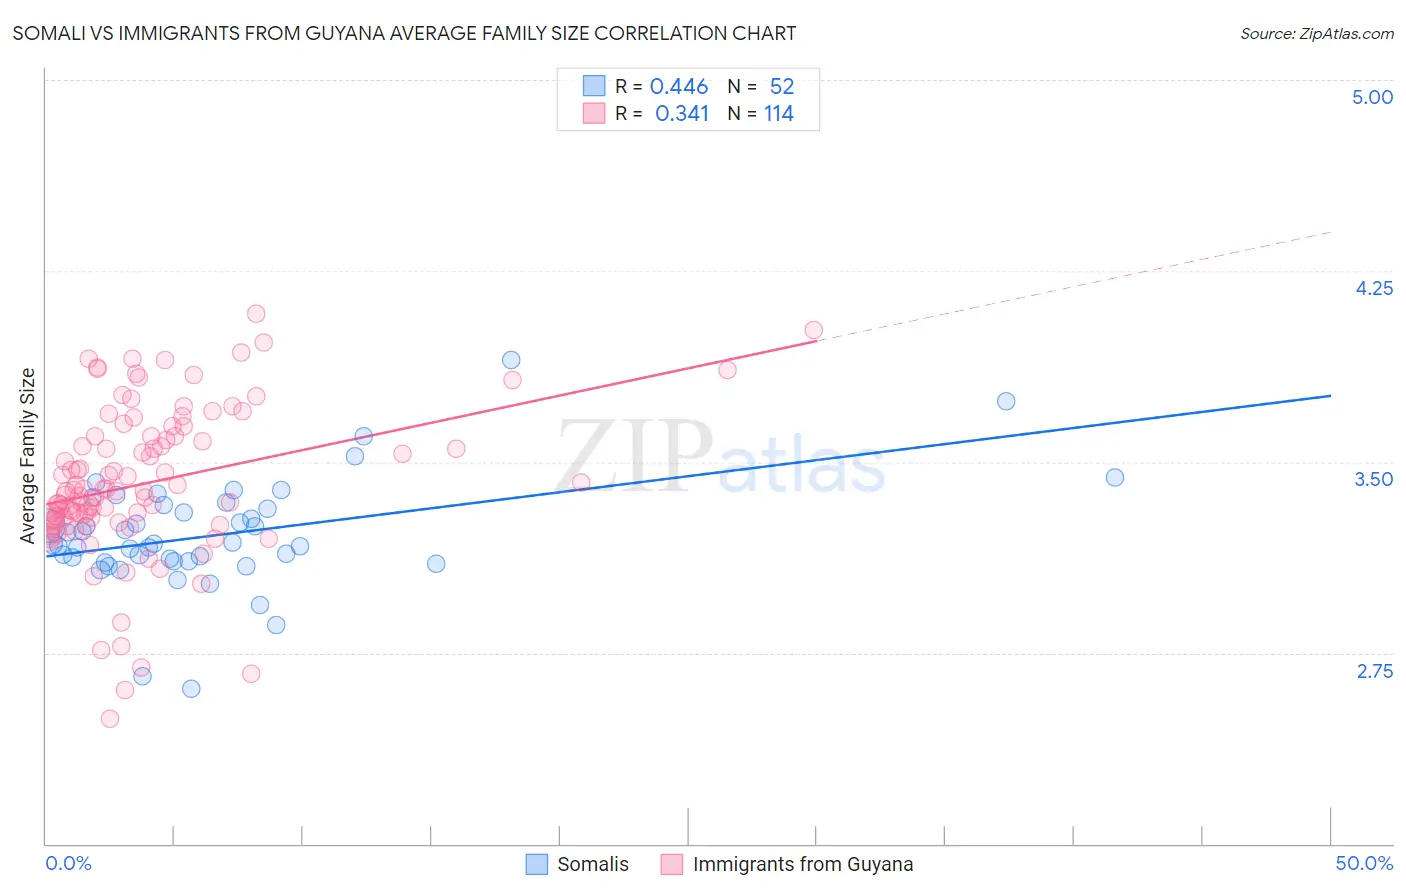
Somali vs Immigrants from Guyana Average Family Size Correlation Chart
The statistical analysis conducted on geographies consisting of 99,260,153 people shows a moderate positive correlation between the proportion of Somalis and average family size in the United States with a correlation coefficient (R) of 0.446 and weighted average of 3.20. Similarly, the statistical analysis conducted on geographies consisting of 183,692,650 people shows a mild positive correlation between the proportion of Immigrants from Guyana and average family size in the United States with a correlation coefficient (R) of 0.341 and weighted average of 3.40, a difference of 6.4%.
Average Family Size Correlation Summary
| Measurement | Somali | Immigrants from Guyana |
| Minimum | 2.61 | 2.49 |
| Maximum | 3.90 | 4.08 |
| Range | 1.29 | 1.59 |
| Mean | 3.21 | 3.42 |
| Median | 3.18 | 3.38 |
| Interquartile 25% (IQ1) | 3.11 | 3.27 |
| Interquartile 75% (IQ3) | 3.32 | 3.60 |
| Interquartile Range (IQR) | 0.21 | 0.33 |
| Standard Deviation (Sample) | 0.22 | 0.30 |
| Standard Deviation (Population) | 0.21 | 0.30 |
Similar Demographics by Average Family Size
Demographics Similar to Somalis by Average Family Size
In terms of average family size, the demographic groups most similar to Somalis are Delaware (3.20, a difference of 0.010%), Bermudan (3.20, a difference of 0.010%), Mongolian (3.20, a difference of 0.020%), Immigrants from Iran (3.20, a difference of 0.040%), and Creek (3.20, a difference of 0.040%).
| Demographics | Rating | Rank | Average Family Size |
| Filipinos | 13.6 /100 | #207 | Poor 3.20 |
| Chippewa | 13.3 /100 | #208 | Poor 3.20 |
| Sudanese | 13.3 /100 | #209 | Poor 3.20 |
| Zimbabweans | 12.6 /100 | #210 | Poor 3.20 |
| Immigrants | Iran | 12.1 /100 | #211 | Poor 3.20 |
| Creek | 12.1 /100 | #212 | Poor 3.20 |
| Mongolians | 11.5 /100 | #213 | Poor 3.20 |
| Somalis | 11.2 /100 | #214 | Poor 3.20 |
| Delaware | 11.1 /100 | #215 | Poor 3.20 |
| Bermudans | 11.0 /100 | #216 | Poor 3.20 |
| Immigrants | Somalia | 10.3 /100 | #217 | Poor 3.20 |
| French American Indians | 9.8 /100 | #218 | Tragic 3.20 |
| Pennsylvania Germans | 9.3 /100 | #219 | Tragic 3.19 |
| Lebanese | 9.1 /100 | #220 | Tragic 3.19 |
| Immigrants | Ukraine | 7.2 /100 | #221 | Tragic 3.19 |
Demographics Similar to Immigrants from Guyana by Average Family Size
In terms of average family size, the demographic groups most similar to Immigrants from Guyana are Guatemalan (3.40, a difference of 0.050%), Hispanic or Latino (3.41, a difference of 0.11%), Guyanese (3.40, a difference of 0.14%), Hawaiian (3.41, a difference of 0.16%), and Immigrants from Guatemala (3.41, a difference of 0.19%).
| Demographics | Rating | Rank | Average Family Size |
| Nepalese | 100.0 /100 | #29 | Exceptional 3.42 |
| Samoans | 100.0 /100 | #30 | Exceptional 3.42 |
| Central Americans | 100.0 /100 | #31 | Exceptional 3.41 |
| Immigrants | Guatemala | 100.0 /100 | #32 | Exceptional 3.41 |
| Hawaiians | 100.0 /100 | #33 | Exceptional 3.41 |
| Hispanics or Latinos | 100.0 /100 | #34 | Exceptional 3.41 |
| Guatemalans | 100.0 /100 | #35 | Exceptional 3.40 |
| Immigrants | Guyana | 100.0 /100 | #36 | Exceptional 3.40 |
| Guyanese | 100.0 /100 | #37 | Exceptional 3.40 |
| Immigrants | Belize | 100.0 /100 | #38 | Exceptional 3.39 |
| Immigrants | Haiti | 100.0 /100 | #39 | Exceptional 3.39 |
| Belizeans | 100.0 /100 | #40 | Exceptional 3.39 |
| Marshallese | 100.0 /100 | #41 | Exceptional 3.38 |
| Immigrants | Vietnam | 100.0 /100 | #42 | Exceptional 3.38 |
| Immigrants | Philippines | 100.0 /100 | #43 | Exceptional 3.37 |