Somali vs Hungarian Average Family Size
COMPARE
Somali
Hungarian
Average Family Size
Average Family Size Comparison
Somalis
Hungarians
3.20
AVERAGE FAMILY SIZE
11.2/ 100
METRIC RATING
214th/ 347
METRIC RANK
3.18
AVERAGE FAMILY SIZE
3.0/ 100
METRIC RATING
242nd/ 347
METRIC RANK
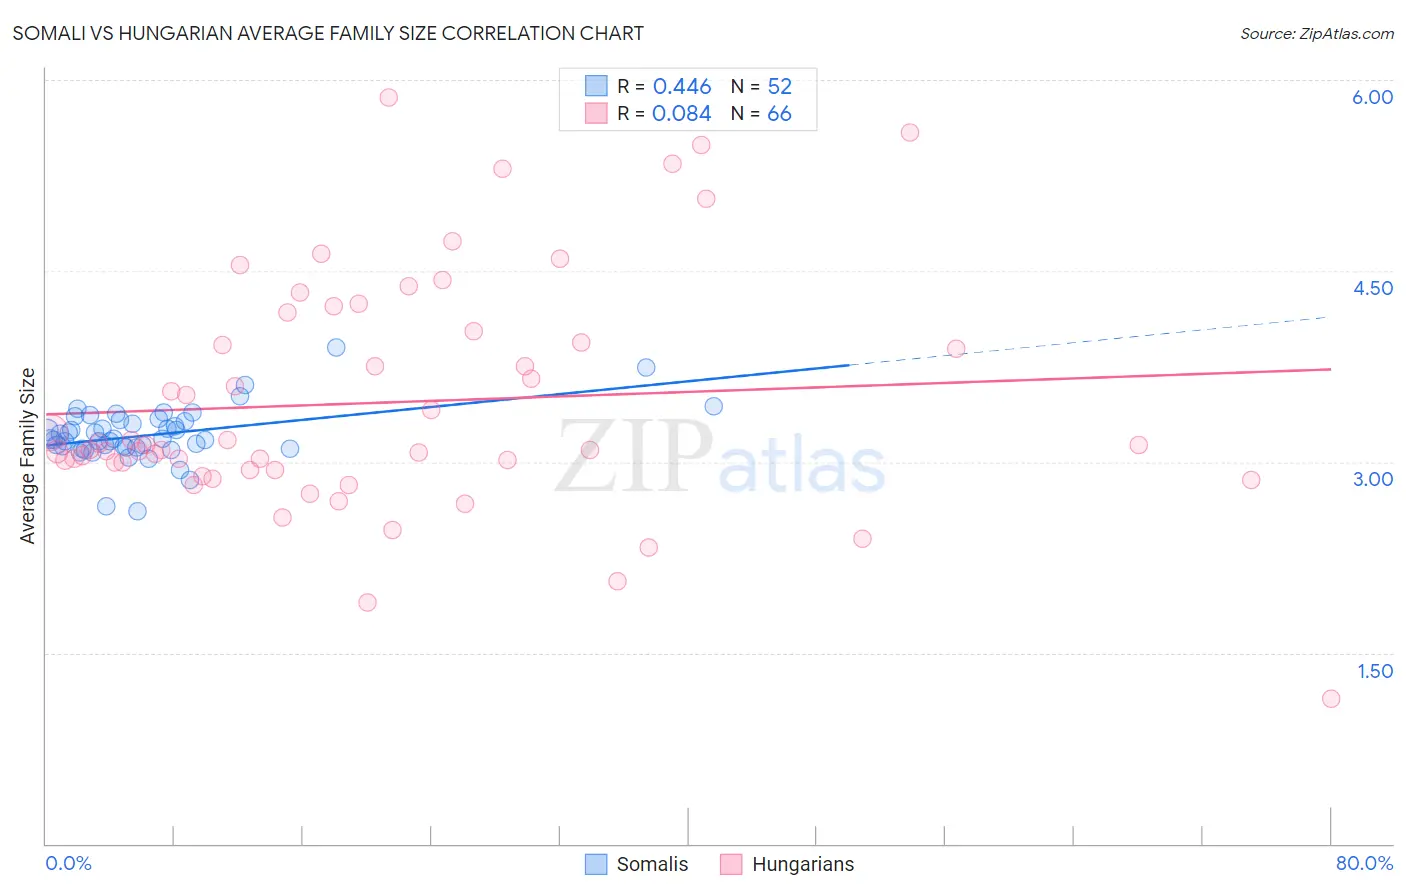
Somali vs Hungarian Average Family Size Correlation Chart
The statistical analysis conducted on geographies consisting of 99,260,153 people shows a moderate positive correlation between the proportion of Somalis and average family size in the United States with a correlation coefficient (R) of 0.446 and weighted average of 3.20. Similarly, the statistical analysis conducted on geographies consisting of 485,906,700 people shows a slight positive correlation between the proportion of Hungarians and average family size in the United States with a correlation coefficient (R) of 0.084 and weighted average of 3.18, a difference of 0.66%.
Average Family Size Correlation Summary
| Measurement | Somali | Hungarian |
| Minimum | 2.61 | 1.14 |
| Maximum | 3.90 | 5.86 |
| Range | 1.29 | 4.72 |
| Mean | 3.21 | 3.47 |
| Median | 3.18 | 3.11 |
| Interquartile 25% (IQ1) | 3.11 | 2.94 |
| Interquartile 75% (IQ3) | 3.32 | 4.03 |
| Interquartile Range (IQR) | 0.21 | 1.09 |
| Standard Deviation (Sample) | 0.22 | 0.93 |
| Standard Deviation (Population) | 0.21 | 0.92 |
Similar Demographics by Average Family Size
Demographics Similar to Somalis by Average Family Size
In terms of average family size, the demographic groups most similar to Somalis are Delaware (3.20, a difference of 0.010%), Bermudan (3.20, a difference of 0.010%), Mongolian (3.20, a difference of 0.020%), Immigrants from Iran (3.20, a difference of 0.040%), and Creek (3.20, a difference of 0.040%).
| Demographics | Rating | Rank | Average Family Size |
| Filipinos | 13.6 /100 | #207 | Poor 3.20 |
| Chippewa | 13.3 /100 | #208 | Poor 3.20 |
| Sudanese | 13.3 /100 | #209 | Poor 3.20 |
| Zimbabweans | 12.6 /100 | #210 | Poor 3.20 |
| Immigrants | Iran | 12.1 /100 | #211 | Poor 3.20 |
| Creek | 12.1 /100 | #212 | Poor 3.20 |
| Mongolians | 11.5 /100 | #213 | Poor 3.20 |
| Somalis | 11.2 /100 | #214 | Poor 3.20 |
| Delaware | 11.1 /100 | #215 | Poor 3.20 |
| Bermudans | 11.0 /100 | #216 | Poor 3.20 |
| Immigrants | Somalia | 10.3 /100 | #217 | Poor 3.20 |
| French American Indians | 9.8 /100 | #218 | Tragic 3.20 |
| Pennsylvania Germans | 9.3 /100 | #219 | Tragic 3.19 |
| Lebanese | 9.1 /100 | #220 | Tragic 3.19 |
| Immigrants | Ukraine | 7.2 /100 | #221 | Tragic 3.19 |
Demographics Similar to Hungarians by Average Family Size
In terms of average family size, the demographic groups most similar to Hungarians are Immigrants from Moldova (3.18, a difference of 0.0%), Immigrants from Southern Europe (3.18, a difference of 0.010%), Immigrants from Japan (3.18, a difference of 0.020%), Osage (3.18, a difference of 0.040%), and Immigrants from Brazil (3.18, a difference of 0.040%).
| Demographics | Rating | Rank | Average Family Size |
| Immigrants | Turkey | 4.2 /100 | #235 | Tragic 3.18 |
| Immigrants | Portugal | 4.2 /100 | #236 | Tragic 3.18 |
| Immigrants | Romania | 3.7 /100 | #237 | Tragic 3.18 |
| Romanians | 3.7 /100 | #238 | Tragic 3.18 |
| Houma | 3.4 /100 | #239 | Tragic 3.18 |
| Osage | 3.2 /100 | #240 | Tragic 3.18 |
| Immigrants | Japan | 3.0 /100 | #241 | Tragic 3.18 |
| Hungarians | 3.0 /100 | #242 | Tragic 3.18 |
| Immigrants | Moldova | 2.9 /100 | #243 | Tragic 3.18 |
| Immigrants | Southern Europe | 2.9 /100 | #244 | Tragic 3.18 |
| Immigrants | Brazil | 2.7 /100 | #245 | Tragic 3.18 |
| Danes | 2.5 /100 | #246 | Tragic 3.17 |
| Cajuns | 2.4 /100 | #247 | Tragic 3.17 |
| Immigrants | Belarus | 2.3 /100 | #248 | Tragic 3.17 |
| Immigrants | Eastern Europe | 2.1 /100 | #249 | Tragic 3.17 |