Somali vs Immigrants from Pakistan Average Family Size
COMPARE
Somali
Immigrants from Pakistan
Average Family Size
Average Family Size Comparison
Somalis
Immigrants from Pakistan
3.20
AVERAGE FAMILY SIZE
11.2/ 100
METRIC RATING
214th/ 347
METRIC RANK
3.30
AVERAGE FAMILY SIZE
99.2/ 100
METRIC RATING
91st/ 347
METRIC RANK
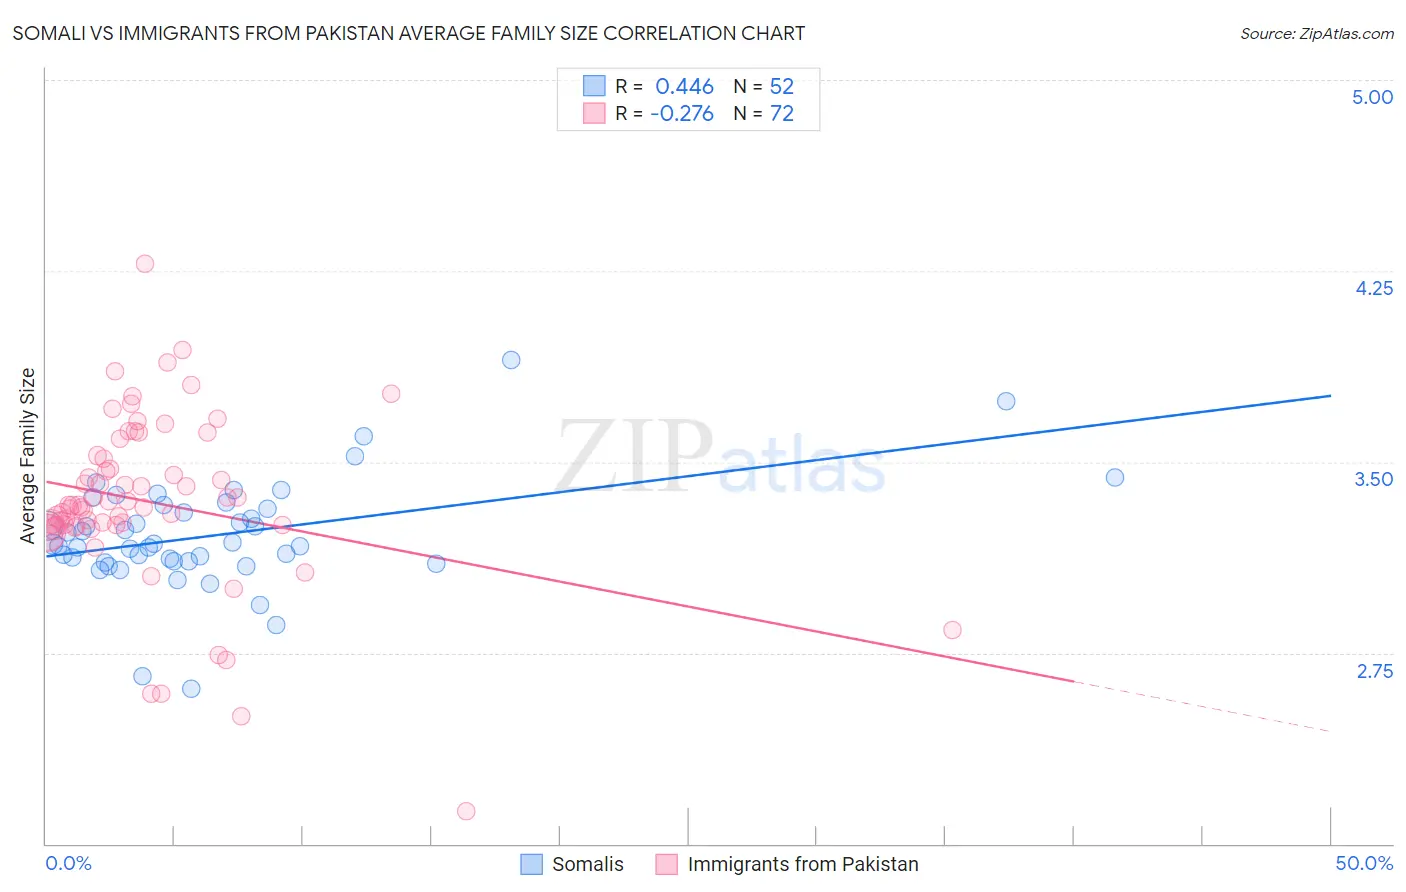
Somali vs Immigrants from Pakistan Average Family Size Correlation Chart
The statistical analysis conducted on geographies consisting of 99,260,153 people shows a moderate positive correlation between the proportion of Somalis and average family size in the United States with a correlation coefficient (R) of 0.446 and weighted average of 3.20. Similarly, the statistical analysis conducted on geographies consisting of 283,802,176 people shows a weak negative correlation between the proportion of Immigrants from Pakistan and average family size in the United States with a correlation coefficient (R) of -0.276 and weighted average of 3.30, a difference of 3.2%.
Average Family Size Correlation Summary
| Measurement | Somali | Immigrants from Pakistan |
| Minimum | 2.61 | 2.13 |
| Maximum | 3.90 | 4.28 |
| Range | 1.29 | 2.15 |
| Mean | 3.21 | 3.34 |
| Median | 3.18 | 3.33 |
| Interquartile 25% (IQ1) | 3.11 | 3.25 |
| Interquartile 75% (IQ3) | 3.32 | 3.52 |
| Interquartile Range (IQR) | 0.21 | 0.27 |
| Standard Deviation (Sample) | 0.22 | 0.34 |
| Standard Deviation (Population) | 0.21 | 0.34 |
Similar Demographics by Average Family Size
Demographics Similar to Somalis by Average Family Size
In terms of average family size, the demographic groups most similar to Somalis are Delaware (3.20, a difference of 0.010%), Bermudan (3.20, a difference of 0.010%), Mongolian (3.20, a difference of 0.020%), Immigrants from Iran (3.20, a difference of 0.040%), and Creek (3.20, a difference of 0.040%).
| Demographics | Rating | Rank | Average Family Size |
| Filipinos | 13.6 /100 | #207 | Poor 3.20 |
| Chippewa | 13.3 /100 | #208 | Poor 3.20 |
| Sudanese | 13.3 /100 | #209 | Poor 3.20 |
| Zimbabweans | 12.6 /100 | #210 | Poor 3.20 |
| Immigrants | Iran | 12.1 /100 | #211 | Poor 3.20 |
| Creek | 12.1 /100 | #212 | Poor 3.20 |
| Mongolians | 11.5 /100 | #213 | Poor 3.20 |
| Somalis | 11.2 /100 | #214 | Poor 3.20 |
| Delaware | 11.1 /100 | #215 | Poor 3.20 |
| Bermudans | 11.0 /100 | #216 | Poor 3.20 |
| Immigrants | Somalia | 10.3 /100 | #217 | Poor 3.20 |
| French American Indians | 9.8 /100 | #218 | Tragic 3.20 |
| Pennsylvania Germans | 9.3 /100 | #219 | Tragic 3.19 |
| Lebanese | 9.1 /100 | #220 | Tragic 3.19 |
| Immigrants | Ukraine | 7.2 /100 | #221 | Tragic 3.19 |
Demographics Similar to Immigrants from Pakistan by Average Family Size
In terms of average family size, the demographic groups most similar to Immigrants from Pakistan are Immigrants from Cameroon (3.30, a difference of 0.010%), Peruvian (3.30, a difference of 0.020%), Sierra Leonean (3.30, a difference of 0.12%), Immigrants from Lebanon (3.30, a difference of 0.13%), and Menominee (3.30, a difference of 0.15%).
| Demographics | Rating | Rank | Average Family Size |
| Immigrants | Nigeria | 99.7 /100 | #84 | Exceptional 3.32 |
| Afghans | 99.7 /100 | #85 | Exceptional 3.31 |
| Jamaicans | 99.7 /100 | #86 | Exceptional 3.31 |
| Immigrants | Peru | 99.7 /100 | #87 | Exceptional 3.31 |
| Immigrants | Bolivia | 99.6 /100 | #88 | Exceptional 3.31 |
| Malaysians | 99.6 /100 | #89 | Exceptional 3.31 |
| Menominee | 99.4 /100 | #90 | Exceptional 3.30 |
| Immigrants | Pakistan | 99.2 /100 | #91 | Exceptional 3.30 |
| Immigrants | Cameroon | 99.2 /100 | #92 | Exceptional 3.30 |
| Peruvians | 99.2 /100 | #93 | Exceptional 3.30 |
| Sierra Leoneans | 99.0 /100 | #94 | Exceptional 3.30 |
| Immigrants | Lebanon | 99.0 /100 | #95 | Exceptional 3.30 |
| U.S. Virgin Islanders | 98.8 /100 | #96 | Exceptional 3.29 |
| Immigrants | Oceania | 98.7 /100 | #97 | Exceptional 3.29 |
| Barbadians | 98.6 /100 | #98 | Exceptional 3.29 |