Sierra Leonean vs Somali Married-couple Households
COMPARE
Sierra Leonean
Somali
Married-couple Households
Married-couple Households Comparison
Sierra Leoneans
Somalis
42.9%
MARRIED-COUPLE HOUSEHOLDS
0.0/ 100
METRIC RATING
279th/ 347
METRIC RANK
39.0%
MARRIED-COUPLE HOUSEHOLDS
0.0/ 100
METRIC RATING
332nd/ 347
METRIC RANK
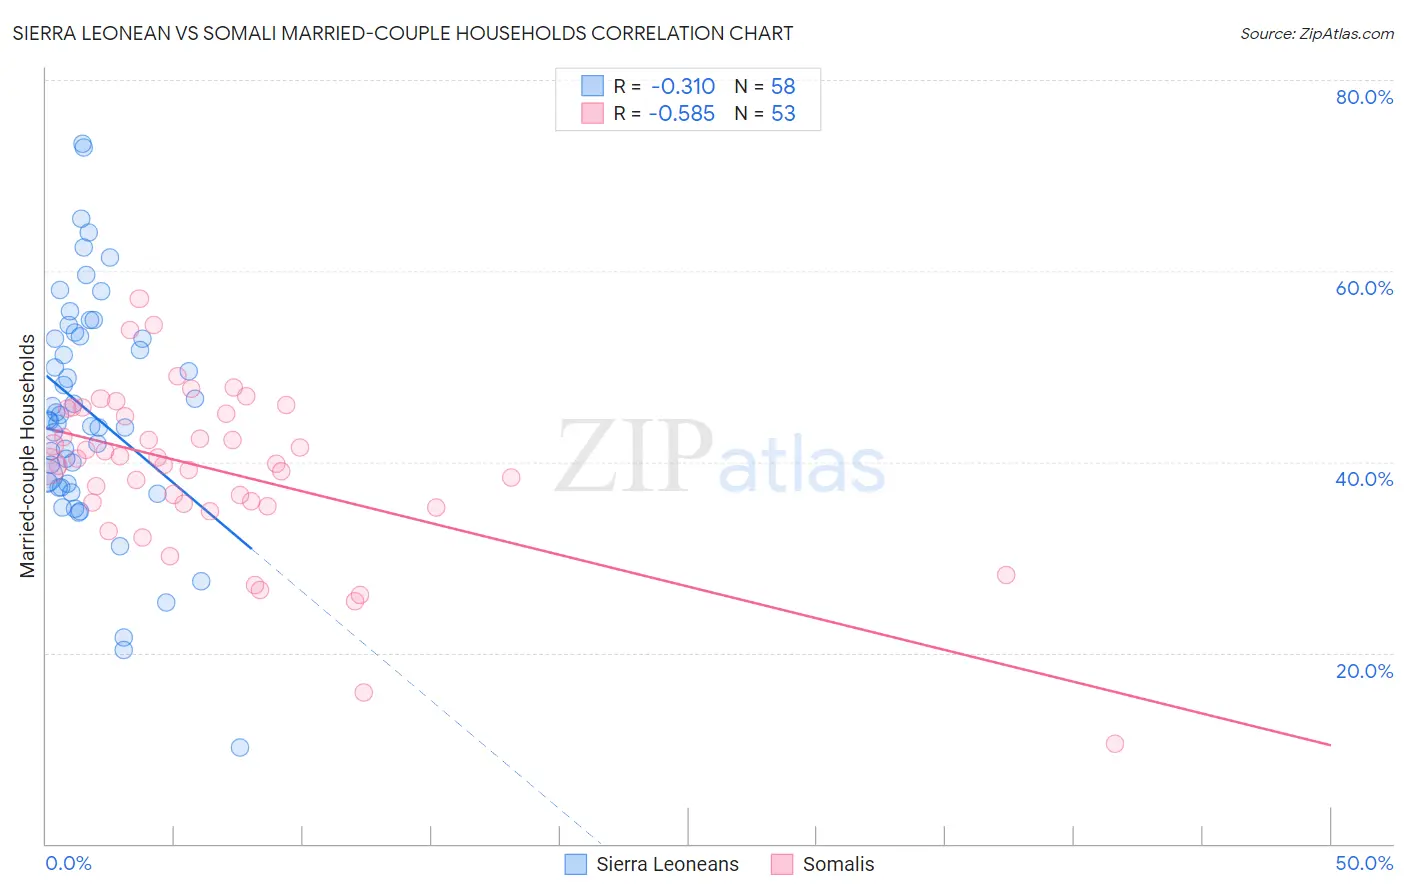
Sierra Leonean vs Somali Married-couple Households Correlation Chart
The statistical analysis conducted on geographies consisting of 83,352,562 people shows a mild negative correlation between the proportion of Sierra Leoneans and percentage of married-couple family households in the United States with a correlation coefficient (R) of -0.310 and weighted average of 42.9%. Similarly, the statistical analysis conducted on geographies consisting of 99,290,778 people shows a substantial negative correlation between the proportion of Somalis and percentage of married-couple family households in the United States with a correlation coefficient (R) of -0.585 and weighted average of 39.0%, a difference of 10.0%.
Married-couple Households Correlation Summary
| Measurement | Sierra Leonean | Somali |
| Minimum | 10.1% | 10.5% |
| Maximum | 73.4% | 57.0% |
| Range | 63.3% | 46.6% |
| Mean | 45.2% | 39.1% |
| Median | 44.4% | 39.8% |
| Interquartile 25% (IQ1) | 37.7% | 35.5% |
| Interquartile 75% (IQ3) | 53.1% | 45.3% |
| Interquartile Range (IQR) | 15.4% | 9.8% |
| Standard Deviation (Sample) | 12.2% | 8.7% |
| Standard Deviation (Population) | 12.1% | 8.6% |
Similar Demographics by Married-couple Households
Demographics Similar to Sierra Leoneans by Married-couple Households
In terms of married-couple households, the demographic groups most similar to Sierra Leoneans are Immigrants from Africa (42.9%, a difference of 0.030%), Immigrants from Ecuador (42.9%, a difference of 0.050%), Immigrants from Guatemala (42.8%, a difference of 0.13%), Immigrants from Eastern Africa (42.9%, a difference of 0.14%), and Immigrants from Ethiopia (43.1%, a difference of 0.39%).
| Demographics | Rating | Rank | Married-couple Households |
| Immigrants | Nigeria | 0.1 /100 | #272 | Tragic 43.2% |
| Ethiopians | 0.1 /100 | #273 | Tragic 43.2% |
| Nigerians | 0.1 /100 | #274 | Tragic 43.2% |
| Immigrants | Bangladesh | 0.0 /100 | #275 | Tragic 43.1% |
| Immigrants | Ethiopia | 0.0 /100 | #276 | Tragic 43.1% |
| Immigrants | Eastern Africa | 0.0 /100 | #277 | Tragic 42.9% |
| Immigrants | Africa | 0.0 /100 | #278 | Tragic 42.9% |
| Sierra Leoneans | 0.0 /100 | #279 | Tragic 42.9% |
| Immigrants | Ecuador | 0.0 /100 | #280 | Tragic 42.9% |
| Immigrants | Guatemala | 0.0 /100 | #281 | Tragic 42.8% |
| Bermudans | 0.0 /100 | #282 | Tragic 42.4% |
| Inupiat | 0.0 /100 | #283 | Tragic 42.4% |
| Cheyenne | 0.0 /100 | #284 | Tragic 42.3% |
| Ghanaians | 0.0 /100 | #285 | Tragic 42.2% |
| Belizeans | 0.0 /100 | #286 | Tragic 42.2% |
Demographics Similar to Somalis by Married-couple Households
In terms of married-couple households, the demographic groups most similar to Somalis are Immigrants from West Indies (39.0%, a difference of 0.030%), Immigrants from Congo (39.0%, a difference of 0.090%), Immigrants from Barbados (39.2%, a difference of 0.52%), Immigrants from St. Vincent and the Grenadines (38.7%, a difference of 0.81%), and Immigrants from Dominica (39.4%, a difference of 0.96%).
| Demographics | Rating | Rank | Married-couple Households |
| Pueblo | 0.0 /100 | #325 | Tragic 40.0% |
| U.S. Virgin Islanders | 0.0 /100 | #326 | Tragic 39.8% |
| Lumbee | 0.0 /100 | #327 | Tragic 39.6% |
| Barbadians | 0.0 /100 | #328 | Tragic 39.4% |
| Immigrants | Dominica | 0.0 /100 | #329 | Tragic 39.4% |
| Immigrants | Barbados | 0.0 /100 | #330 | Tragic 39.2% |
| Immigrants | Congo | 0.0 /100 | #331 | Tragic 39.0% |
| Somalis | 0.0 /100 | #332 | Tragic 39.0% |
| Immigrants | West Indies | 0.0 /100 | #333 | Tragic 39.0% |
| Immigrants | St. Vincent and the Grenadines | 0.0 /100 | #334 | Tragic 38.7% |
| Senegalese | 0.0 /100 | #335 | Tragic 38.6% |
| Blacks/African Americans | 0.0 /100 | #336 | Tragic 38.5% |
| Immigrants | Somalia | 0.0 /100 | #337 | Tragic 38.4% |
| Immigrants | Senegal | 0.0 /100 | #338 | Tragic 38.4% |
| British West Indians | 0.0 /100 | #339 | Tragic 38.3% |