Immigrants from Taiwan vs Somali Married-couple Households
COMPARE
Immigrants from Taiwan
Somali
Married-couple Households
Married-couple Households Comparison
Immigrants from Taiwan
Somalis
52.4%
MARRIED-COUPLE HOUSEHOLDS
100.0/ 100
METRIC RATING
2nd/ 347
METRIC RANK
39.0%
MARRIED-COUPLE HOUSEHOLDS
0.0/ 100
METRIC RATING
332nd/ 347
METRIC RANK
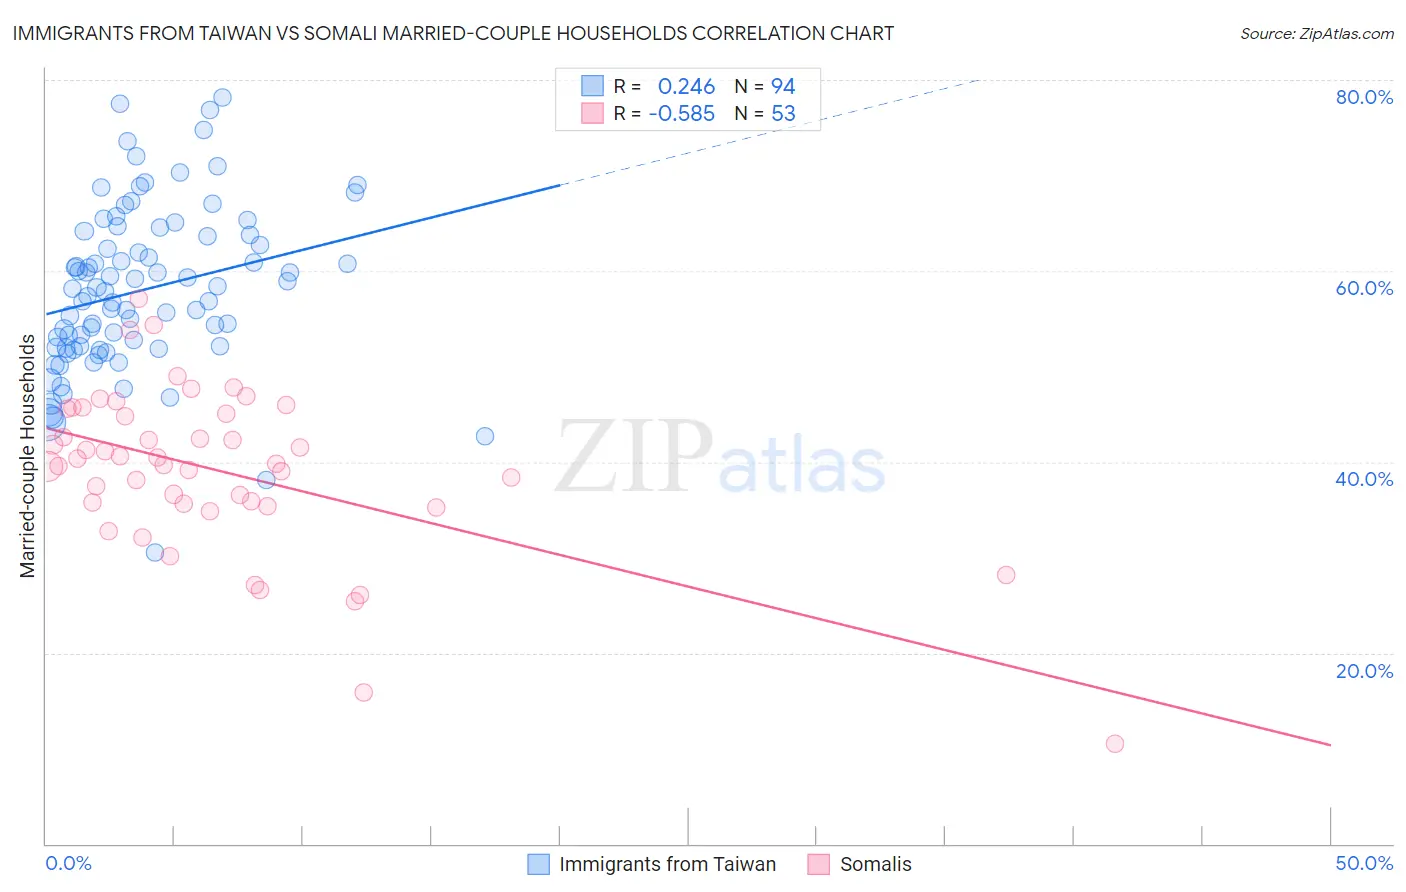
Immigrants from Taiwan vs Somali Married-couple Households Correlation Chart
The statistical analysis conducted on geographies consisting of 298,148,456 people shows a weak positive correlation between the proportion of Immigrants from Taiwan and percentage of married-couple family households in the United States with a correlation coefficient (R) of 0.246 and weighted average of 52.4%. Similarly, the statistical analysis conducted on geographies consisting of 99,290,778 people shows a substantial negative correlation between the proportion of Somalis and percentage of married-couple family households in the United States with a correlation coefficient (R) of -0.585 and weighted average of 39.0%, a difference of 34.4%.
Married-couple Households Correlation Summary
| Measurement | Immigrants from Taiwan | Somali |
| Minimum | 30.6% | 10.5% |
| Maximum | 78.2% | 57.0% |
| Range | 47.6% | 46.6% |
| Mean | 58.0% | 39.1% |
| Median | 58.0% | 39.8% |
| Interquartile 25% (IQ1) | 51.9% | 35.5% |
| Interquartile 75% (IQ3) | 63.8% | 45.3% |
| Interquartile Range (IQR) | 11.8% | 9.8% |
| Standard Deviation (Sample) | 8.7% | 8.7% |
| Standard Deviation (Population) | 8.6% | 8.6% |
Similar Demographics by Married-couple Households
Demographics Similar to Immigrants from Taiwan by Married-couple Households
In terms of married-couple households, the demographic groups most similar to Immigrants from Taiwan are Immigrants from India (52.7%, a difference of 0.61%), Thai (51.9%, a difference of 0.97%), Assyrian/Chaldean/Syriac (51.8%, a difference of 1.2%), Tongan (51.6%, a difference of 1.7%), and Danish (51.1%, a difference of 2.6%).
| Demographics | Rating | Rank | Married-couple Households |
| Immigrants | India | 100.0 /100 | #1 | Exceptional 52.7% |
| Immigrants | Taiwan | 100.0 /100 | #2 | Exceptional 52.4% |
| Thais | 100.0 /100 | #3 | Exceptional 51.9% |
| Assyrians/Chaldeans/Syriacs | 100.0 /100 | #4 | Exceptional 51.8% |
| Tongans | 100.0 /100 | #5 | Exceptional 51.6% |
| Danes | 100.0 /100 | #6 | Exceptional 51.1% |
| Filipinos | 100.0 /100 | #7 | Exceptional 51.0% |
| Immigrants | South Central Asia | 100.0 /100 | #8 | Exceptional 50.6% |
| Pennsylvania Germans | 100.0 /100 | #9 | Exceptional 50.4% |
| Chinese | 100.0 /100 | #10 | Exceptional 50.4% |
| Immigrants | Pakistan | 100.0 /100 | #11 | Exceptional 50.1% |
| Swiss | 100.0 /100 | #12 | Exceptional 49.9% |
| Immigrants | Korea | 100.0 /100 | #13 | Exceptional 49.9% |
| Burmese | 100.0 /100 | #14 | Exceptional 49.8% |
| Koreans | 99.9 /100 | #15 | Exceptional 49.7% |
Demographics Similar to Somalis by Married-couple Households
In terms of married-couple households, the demographic groups most similar to Somalis are Immigrants from West Indies (39.0%, a difference of 0.030%), Immigrants from Congo (39.0%, a difference of 0.090%), Immigrants from Barbados (39.2%, a difference of 0.52%), Immigrants from St. Vincent and the Grenadines (38.7%, a difference of 0.81%), and Immigrants from Dominica (39.4%, a difference of 0.96%).
| Demographics | Rating | Rank | Married-couple Households |
| Pueblo | 0.0 /100 | #325 | Tragic 40.0% |
| U.S. Virgin Islanders | 0.0 /100 | #326 | Tragic 39.8% |
| Lumbee | 0.0 /100 | #327 | Tragic 39.6% |
| Barbadians | 0.0 /100 | #328 | Tragic 39.4% |
| Immigrants | Dominica | 0.0 /100 | #329 | Tragic 39.4% |
| Immigrants | Barbados | 0.0 /100 | #330 | Tragic 39.2% |
| Immigrants | Congo | 0.0 /100 | #331 | Tragic 39.0% |
| Somalis | 0.0 /100 | #332 | Tragic 39.0% |
| Immigrants | West Indies | 0.0 /100 | #333 | Tragic 39.0% |
| Immigrants | St. Vincent and the Grenadines | 0.0 /100 | #334 | Tragic 38.7% |
| Senegalese | 0.0 /100 | #335 | Tragic 38.6% |
| Blacks/African Americans | 0.0 /100 | #336 | Tragic 38.5% |
| Immigrants | Somalia | 0.0 /100 | #337 | Tragic 38.4% |
| Immigrants | Senegal | 0.0 /100 | #338 | Tragic 38.4% |
| British West Indians | 0.0 /100 | #339 | Tragic 38.3% |