Sierra Leonean vs Czech Married-couple Households
COMPARE
Sierra Leonean
Czech
Married-couple Households
Married-couple Households Comparison
Sierra Leoneans
Czechs
42.9%
MARRIED-COUPLE HOUSEHOLDS
0.0/ 100
METRIC RATING
279th/ 347
METRIC RANK
49.4%
MARRIED-COUPLE HOUSEHOLDS
99.9/ 100
METRIC RATING
24th/ 347
METRIC RANK
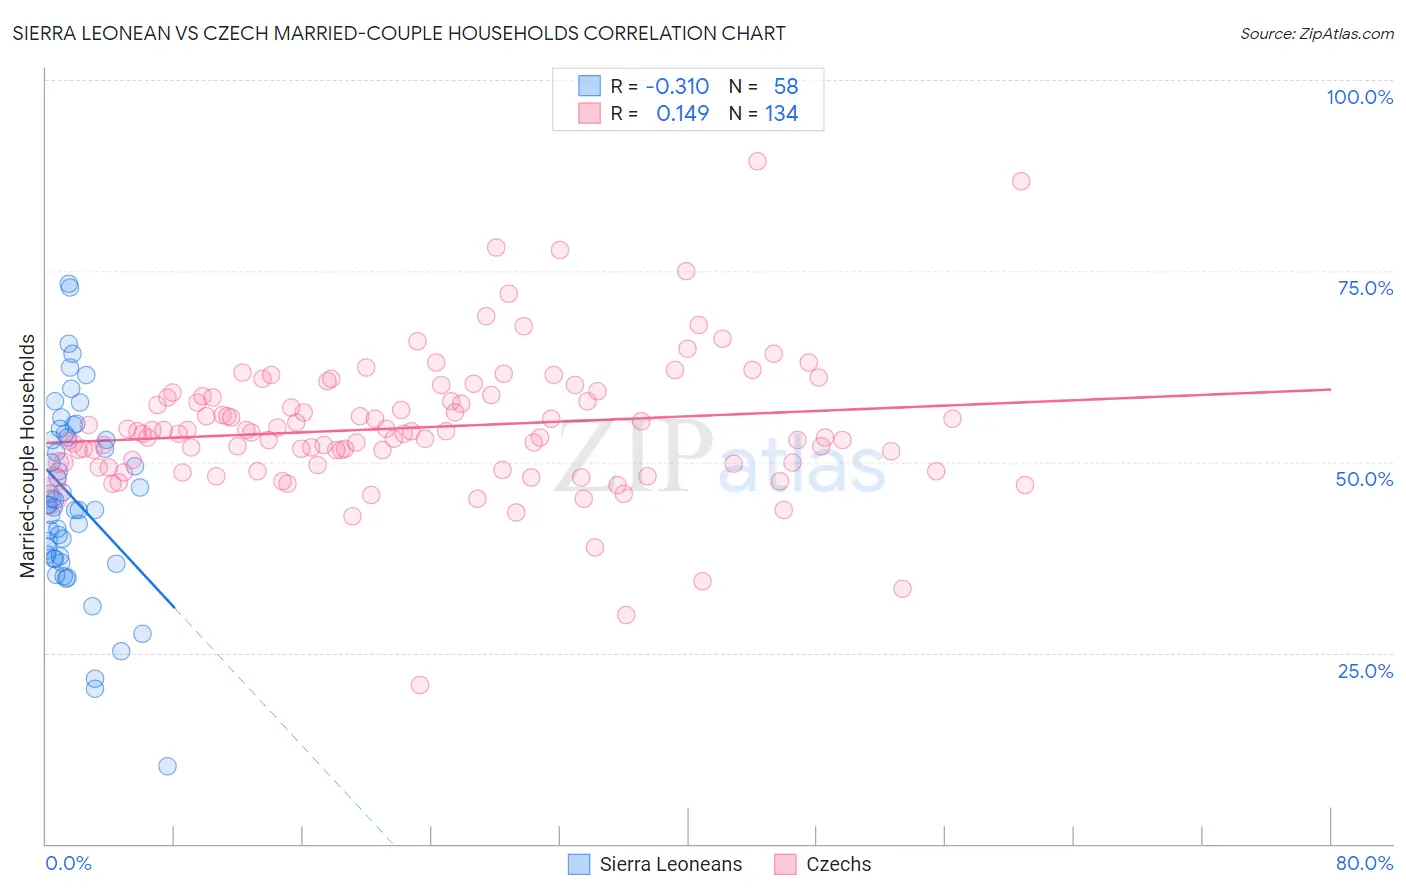
Sierra Leonean vs Czech Married-couple Households Correlation Chart
The statistical analysis conducted on geographies consisting of 83,352,562 people shows a mild negative correlation between the proportion of Sierra Leoneans and percentage of married-couple family households in the United States with a correlation coefficient (R) of -0.310 and weighted average of 42.9%. Similarly, the statistical analysis conducted on geographies consisting of 484,447,060 people shows a poor positive correlation between the proportion of Czechs and percentage of married-couple family households in the United States with a correlation coefficient (R) of 0.149 and weighted average of 49.4%, a difference of 15.3%.
Married-couple Households Correlation Summary
| Measurement | Sierra Leonean | Czech |
| Minimum | 10.1% | 20.8% |
| Maximum | 73.4% | 89.3% |
| Range | 63.3% | 68.5% |
| Mean | 45.2% | 54.5% |
| Median | 44.4% | 53.7% |
| Interquartile 25% (IQ1) | 37.7% | 49.8% |
| Interquartile 75% (IQ3) | 53.1% | 58.5% |
| Interquartile Range (IQR) | 15.4% | 8.6% |
| Standard Deviation (Sample) | 12.2% | 9.0% |
| Standard Deviation (Population) | 12.1% | 9.0% |
Similar Demographics by Married-couple Households
Demographics Similar to Sierra Leoneans by Married-couple Households
In terms of married-couple households, the demographic groups most similar to Sierra Leoneans are Immigrants from Africa (42.9%, a difference of 0.030%), Immigrants from Ecuador (42.9%, a difference of 0.050%), Immigrants from Guatemala (42.8%, a difference of 0.13%), Immigrants from Eastern Africa (42.9%, a difference of 0.14%), and Immigrants from Ethiopia (43.1%, a difference of 0.39%).
| Demographics | Rating | Rank | Married-couple Households |
| Immigrants | Nigeria | 0.1 /100 | #272 | Tragic 43.2% |
| Ethiopians | 0.1 /100 | #273 | Tragic 43.2% |
| Nigerians | 0.1 /100 | #274 | Tragic 43.2% |
| Immigrants | Bangladesh | 0.0 /100 | #275 | Tragic 43.1% |
| Immigrants | Ethiopia | 0.0 /100 | #276 | Tragic 43.1% |
| Immigrants | Eastern Africa | 0.0 /100 | #277 | Tragic 42.9% |
| Immigrants | Africa | 0.0 /100 | #278 | Tragic 42.9% |
| Sierra Leoneans | 0.0 /100 | #279 | Tragic 42.9% |
| Immigrants | Ecuador | 0.0 /100 | #280 | Tragic 42.9% |
| Immigrants | Guatemala | 0.0 /100 | #281 | Tragic 42.8% |
| Bermudans | 0.0 /100 | #282 | Tragic 42.4% |
| Inupiat | 0.0 /100 | #283 | Tragic 42.4% |
| Cheyenne | 0.0 /100 | #284 | Tragic 42.3% |
| Ghanaians | 0.0 /100 | #285 | Tragic 42.2% |
| Belizeans | 0.0 /100 | #286 | Tragic 42.2% |
Demographics Similar to Czechs by Married-couple Households
In terms of married-couple households, the demographic groups most similar to Czechs are Dutch (49.5%, a difference of 0.080%), Asian (49.5%, a difference of 0.090%), Immigrants from Philippines (49.3%, a difference of 0.19%), Norwegian (49.5%, a difference of 0.20%), and European (49.6%, a difference of 0.26%).
| Demographics | Rating | Rank | Married-couple Households |
| Immigrants | Hong Kong | 99.9 /100 | #17 | Exceptional 49.6% |
| English | 99.9 /100 | #18 | Exceptional 49.6% |
| Europeans | 99.9 /100 | #19 | Exceptional 49.6% |
| Scandinavians | 99.9 /100 | #20 | Exceptional 49.6% |
| Norwegians | 99.9 /100 | #21 | Exceptional 49.5% |
| Asians | 99.9 /100 | #22 | Exceptional 49.5% |
| Dutch | 99.9 /100 | #23 | Exceptional 49.5% |
| Czechs | 99.9 /100 | #24 | Exceptional 49.4% |
| Immigrants | Philippines | 99.9 /100 | #25 | Exceptional 49.3% |
| Immigrants | Scotland | 99.8 /100 | #26 | Exceptional 49.3% |
| Bhutanese | 99.8 /100 | #27 | Exceptional 49.3% |
| Germans | 99.8 /100 | #28 | Exceptional 49.2% |
| Maltese | 99.8 /100 | #29 | Exceptional 49.2% |
| Bolivians | 99.8 /100 | #30 | Exceptional 49.2% |
| Native Hawaiians | 99.8 /100 | #31 | Exceptional 49.1% |