Immigrants from Hong Kong vs Somali Married-couple Households
COMPARE
Immigrants from Hong Kong
Somali
Married-couple Households
Married-couple Households Comparison
Immigrants from Hong Kong
Somalis
49.6%
MARRIED-COUPLE HOUSEHOLDS
99.9/ 100
METRIC RATING
17th/ 347
METRIC RANK
39.0%
MARRIED-COUPLE HOUSEHOLDS
0.0/ 100
METRIC RATING
332nd/ 347
METRIC RANK
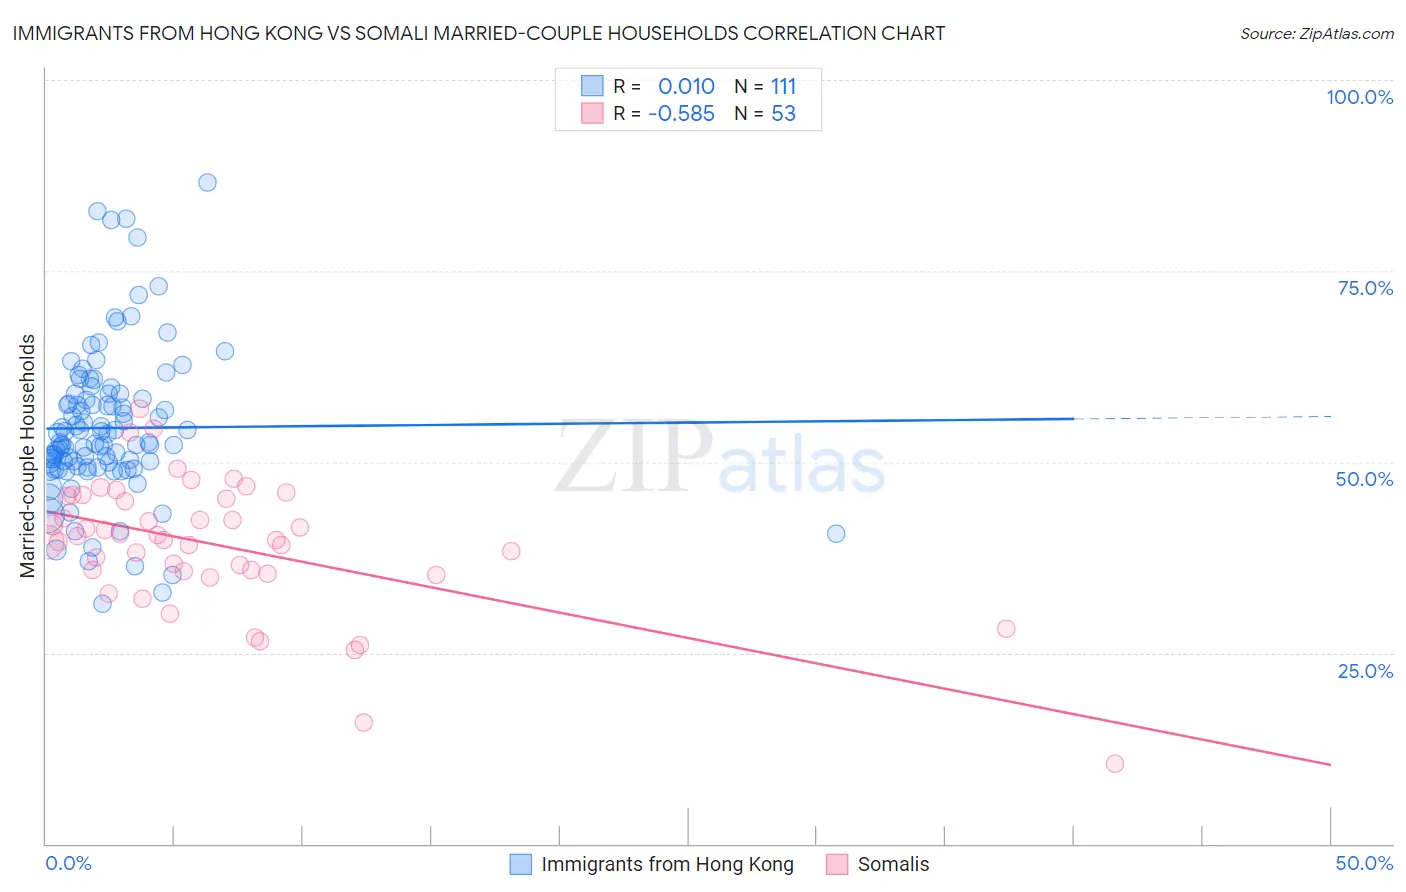
Immigrants from Hong Kong vs Somali Married-couple Households Correlation Chart
The statistical analysis conducted on geographies consisting of 253,895,593 people shows no correlation between the proportion of Immigrants from Hong Kong and percentage of married-couple family households in the United States with a correlation coefficient (R) of 0.010 and weighted average of 49.6%. Similarly, the statistical analysis conducted on geographies consisting of 99,290,778 people shows a substantial negative correlation between the proportion of Somalis and percentage of married-couple family households in the United States with a correlation coefficient (R) of -0.585 and weighted average of 39.0%, a difference of 27.3%.
Married-couple Households Correlation Summary
| Measurement | Immigrants from Hong Kong | Somali |
| Minimum | 31.4% | 10.5% |
| Maximum | 86.6% | 57.0% |
| Range | 55.2% | 46.6% |
| Mean | 54.4% | 39.1% |
| Median | 52.5% | 39.8% |
| Interquartile 25% (IQ1) | 49.3% | 35.5% |
| Interquartile 75% (IQ3) | 58.8% | 45.3% |
| Interquartile Range (IQR) | 9.5% | 9.8% |
| Standard Deviation (Sample) | 9.9% | 8.7% |
| Standard Deviation (Population) | 9.9% | 8.6% |
Similar Demographics by Married-couple Households
Demographics Similar to Immigrants from Hong Kong by Married-couple Households
In terms of married-couple households, the demographic groups most similar to Immigrants from Hong Kong are English (49.6%, a difference of 0.010%), Swedish (49.7%, a difference of 0.15%), European (49.6%, a difference of 0.17%), Scandinavian (49.6%, a difference of 0.17%), and Korean (49.7%, a difference of 0.18%).
| Demographics | Rating | Rank | Married-couple Households |
| Chinese | 100.0 /100 | #10 | Exceptional 50.4% |
| Immigrants | Pakistan | 100.0 /100 | #11 | Exceptional 50.1% |
| Swiss | 100.0 /100 | #12 | Exceptional 49.9% |
| Immigrants | Korea | 100.0 /100 | #13 | Exceptional 49.9% |
| Burmese | 100.0 /100 | #14 | Exceptional 49.8% |
| Koreans | 99.9 /100 | #15 | Exceptional 49.7% |
| Swedes | 99.9 /100 | #16 | Exceptional 49.7% |
| Immigrants | Hong Kong | 99.9 /100 | #17 | Exceptional 49.6% |
| English | 99.9 /100 | #18 | Exceptional 49.6% |
| Europeans | 99.9 /100 | #19 | Exceptional 49.6% |
| Scandinavians | 99.9 /100 | #20 | Exceptional 49.6% |
| Norwegians | 99.9 /100 | #21 | Exceptional 49.5% |
| Asians | 99.9 /100 | #22 | Exceptional 49.5% |
| Dutch | 99.9 /100 | #23 | Exceptional 49.5% |
| Czechs | 99.9 /100 | #24 | Exceptional 49.4% |
Demographics Similar to Somalis by Married-couple Households
In terms of married-couple households, the demographic groups most similar to Somalis are Immigrants from West Indies (39.0%, a difference of 0.030%), Immigrants from Congo (39.0%, a difference of 0.090%), Immigrants from Barbados (39.2%, a difference of 0.52%), Immigrants from St. Vincent and the Grenadines (38.7%, a difference of 0.81%), and Immigrants from Dominica (39.4%, a difference of 0.96%).
| Demographics | Rating | Rank | Married-couple Households |
| Pueblo | 0.0 /100 | #325 | Tragic 40.0% |
| U.S. Virgin Islanders | 0.0 /100 | #326 | Tragic 39.8% |
| Lumbee | 0.0 /100 | #327 | Tragic 39.6% |
| Barbadians | 0.0 /100 | #328 | Tragic 39.4% |
| Immigrants | Dominica | 0.0 /100 | #329 | Tragic 39.4% |
| Immigrants | Barbados | 0.0 /100 | #330 | Tragic 39.2% |
| Immigrants | Congo | 0.0 /100 | #331 | Tragic 39.0% |
| Somalis | 0.0 /100 | #332 | Tragic 39.0% |
| Immigrants | West Indies | 0.0 /100 | #333 | Tragic 39.0% |
| Immigrants | St. Vincent and the Grenadines | 0.0 /100 | #334 | Tragic 38.7% |
| Senegalese | 0.0 /100 | #335 | Tragic 38.6% |
| Blacks/African Americans | 0.0 /100 | #336 | Tragic 38.5% |
| Immigrants | Somalia | 0.0 /100 | #337 | Tragic 38.4% |
| Immigrants | Senegal | 0.0 /100 | #338 | Tragic 38.4% |
| British West Indians | 0.0 /100 | #339 | Tragic 38.3% |