Sierra Leonean vs Immigrants from Czechoslovakia College, Under 1 year
COMPARE
Sierra Leonean
Immigrants from Czechoslovakia
College, Under 1 year
College, Under 1 year Comparison
Sierra Leoneans
Immigrants from Czechoslovakia
66.0%
COLLEGE, UNDER 1 YEAR
67.8/ 100
METRIC RATING
157th/ 347
METRIC RANK
69.6%
COLLEGE, UNDER 1 YEAR
99.7/ 100
METRIC RATING
54th/ 347
METRIC RANK
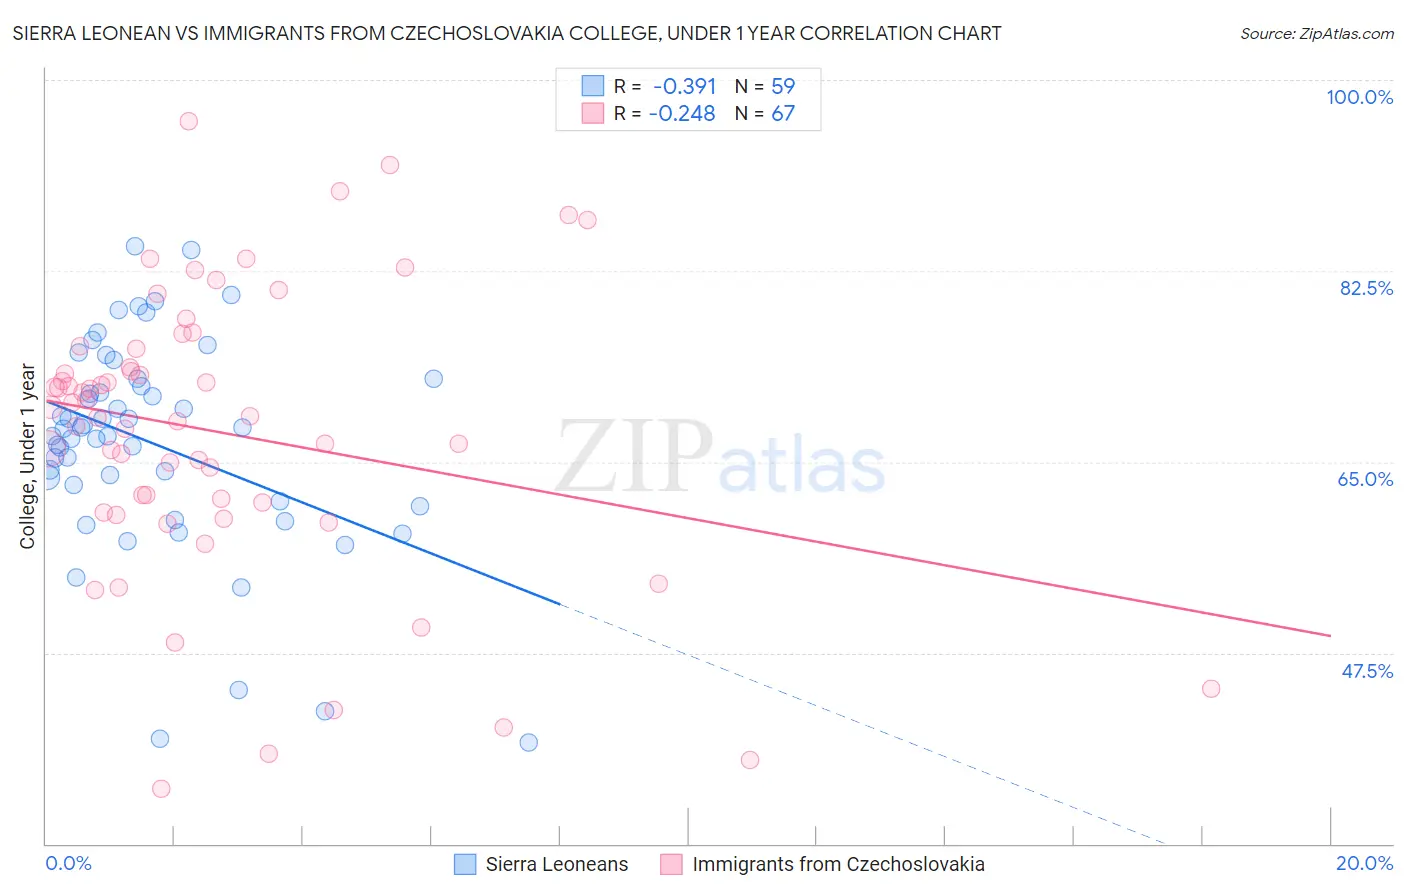
Sierra Leonean vs Immigrants from Czechoslovakia College, Under 1 year Correlation Chart
The statistical analysis conducted on geographies consisting of 83,362,711 people shows a mild negative correlation between the proportion of Sierra Leoneans and percentage of population with at least college, under 1 year education in the United States with a correlation coefficient (R) of -0.391 and weighted average of 66.0%. Similarly, the statistical analysis conducted on geographies consisting of 195,448,477 people shows a weak negative correlation between the proportion of Immigrants from Czechoslovakia and percentage of population with at least college, under 1 year education in the United States with a correlation coefficient (R) of -0.248 and weighted average of 69.6%, a difference of 5.5%.
College, Under 1 year Correlation Summary
| Measurement | Sierra Leonean | Immigrants from Czechoslovakia |
| Minimum | 39.3% | 35.1% |
| Maximum | 84.7% | 96.2% |
| Range | 45.5% | 61.1% |
| Mean | 66.7% | 67.6% |
| Median | 68.1% | 69.2% |
| Interquartile 25% (IQ1) | 61.4% | 60.4% |
| Interquartile 75% (IQ3) | 72.6% | 75.3% |
| Interquartile Range (IQR) | 11.2% | 14.9% |
| Standard Deviation (Sample) | 9.9% | 13.2% |
| Standard Deviation (Population) | 9.8% | 13.1% |
Similar Demographics by College, Under 1 year
Demographics Similar to Sierra Leoneans by College, Under 1 year
In terms of college, under 1 year, the demographic groups most similar to Sierra Leoneans are Celtic (65.9%, a difference of 0.030%), Tlingit-Haida (65.9%, a difference of 0.070%), Albanian (65.9%, a difference of 0.080%), Brazilian (65.9%, a difference of 0.090%), and Welsh (66.0%, a difference of 0.10%).
| Demographics | Rating | Rank | College, Under 1 year |
| Immigrants | Iraq | 77.1 /100 | #150 | Good 66.3% |
| Immigrants | Sudan | 76.0 /100 | #151 | Good 66.2% |
| Sudanese | 74.1 /100 | #152 | Good 66.2% |
| Belgians | 73.7 /100 | #153 | Good 66.2% |
| Immigrants | Eritrea | 71.9 /100 | #154 | Good 66.1% |
| Irish | 70.3 /100 | #155 | Good 66.0% |
| Welsh | 69.9 /100 | #156 | Good 66.0% |
| Sierra Leoneans | 67.8 /100 | #157 | Good 66.0% |
| Celtics | 67.3 /100 | #158 | Good 65.9% |
| Tlingit-Haida | 66.4 /100 | #159 | Good 65.9% |
| Albanians | 66.1 /100 | #160 | Good 65.9% |
| Brazilians | 66.0 /100 | #161 | Good 65.9% |
| Koreans | 65.3 /100 | #162 | Good 65.9% |
| Somalis | 62.7 /100 | #163 | Good 65.8% |
| Czechoslovakians | 62.6 /100 | #164 | Good 65.8% |
Demographics Similar to Immigrants from Czechoslovakia by College, Under 1 year
In terms of college, under 1 year, the demographic groups most similar to Immigrants from Czechoslovakia are Maltese (69.5%, a difference of 0.10%), South African (69.7%, a difference of 0.12%), Immigrants from Scotland (69.4%, a difference of 0.22%), Asian (69.4%, a difference of 0.25%), and Immigrants from Malaysia (69.3%, a difference of 0.34%).
| Demographics | Rating | Rank | College, Under 1 year |
| Immigrants | Bulgaria | 99.8 /100 | #47 | Exceptional 70.0% |
| Immigrants | Netherlands | 99.8 /100 | #48 | Exceptional 70.0% |
| Immigrants | Austria | 99.8 /100 | #49 | Exceptional 70.0% |
| Zimbabweans | 99.8 /100 | #50 | Exceptional 69.9% |
| Mongolians | 99.8 /100 | #51 | Exceptional 69.9% |
| Immigrants | Russia | 99.8 /100 | #52 | Exceptional 69.9% |
| South Africans | 99.7 /100 | #53 | Exceptional 69.7% |
| Immigrants | Czechoslovakia | 99.7 /100 | #54 | Exceptional 69.6% |
| Maltese | 99.7 /100 | #55 | Exceptional 69.5% |
| Immigrants | Scotland | 99.6 /100 | #56 | Exceptional 69.4% |
| Asians | 99.6 /100 | #57 | Exceptional 69.4% |
| Immigrants | Malaysia | 99.6 /100 | #58 | Exceptional 69.3% |
| Immigrants | Serbia | 99.5 /100 | #59 | Exceptional 69.3% |
| Immigrants | Asia | 99.5 /100 | #60 | Exceptional 69.2% |
| Immigrants | Kazakhstan | 99.5 /100 | #61 | Exceptional 69.2% |