Sudanese vs Immigrants from Czechoslovakia Family Households
COMPARE
Sudanese
Immigrants from Czechoslovakia
Family Households
Family Households Comparison
Sudanese
Immigrants from Czechoslovakia
60.0%
FAMILY HOUSEHOLDS
0.0/ 100
METRIC RATING
342nd/ 347
METRIC RANK
63.4%
FAMILY HOUSEHOLDS
1.8/ 100
METRIC RATING
243rd/ 347
METRIC RANK
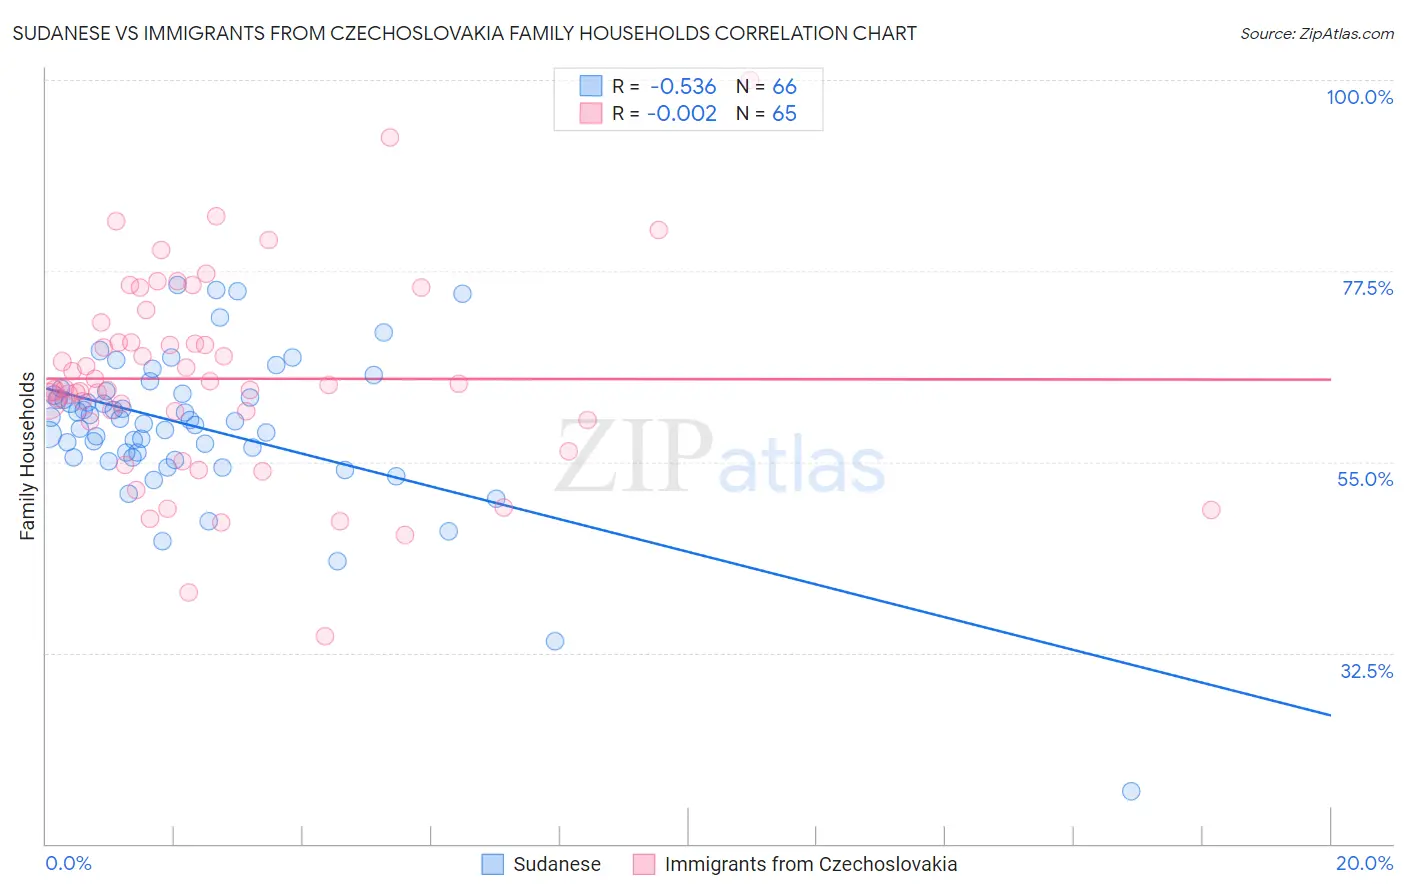
Sudanese vs Immigrants from Czechoslovakia Family Households Correlation Chart
The statistical analysis conducted on geographies consisting of 110,109,646 people shows a substantial negative correlation between the proportion of Sudanese and percentage of family households in the United States with a correlation coefficient (R) of -0.536 and weighted average of 60.0%. Similarly, the statistical analysis conducted on geographies consisting of 195,445,494 people shows no correlation between the proportion of Immigrants from Czechoslovakia and percentage of family households in the United States with a correlation coefficient (R) of -0.002 and weighted average of 63.4%, a difference of 5.7%.
Family Households Correlation Summary
| Measurement | Sudanese | Immigrants from Czechoslovakia |
| Minimum | 16.3% | 34.4% |
| Maximum | 75.8% | 100.0% |
| Range | 59.6% | 65.6% |
| Mean | 59.1% | 64.8% |
| Median | 59.9% | 63.7% |
| Interquartile 25% (IQ1) | 55.6% | 59.9% |
| Interquartile 75% (IQ3) | 63.0% | 70.2% |
| Interquartile Range (IQR) | 7.4% | 10.4% |
| Standard Deviation (Sample) | 9.2% | 11.8% |
| Standard Deviation (Population) | 9.1% | 11.7% |
Similar Demographics by Family Households
Demographics Similar to Sudanese by Family Households
In terms of family households, the demographic groups most similar to Sudanese are Immigrants from Senegal (60.1%, a difference of 0.18%), Immigrants from Sudan (60.2%, a difference of 0.27%), Senegalese (59.8%, a difference of 0.30%), Immigrants from Saudi Arabia (60.7%, a difference of 1.2%), and Immigrants from Congo (59.2%, a difference of 1.3%).
| Demographics | Rating | Rank | Family Households |
| Immigrants | Ethiopia | 0.0 /100 | #333 | Tragic 61.2% |
| Immigrants | Eastern Africa | 0.0 /100 | #334 | Tragic 61.1% |
| Carpatho Rusyns | 0.0 /100 | #335 | Tragic 61.1% |
| German Russians | 0.0 /100 | #336 | Tragic 60.9% |
| Soviet Union | 0.0 /100 | #337 | Tragic 60.9% |
| Immigrants | Eritrea | 0.0 /100 | #338 | Tragic 60.8% |
| Immigrants | Saudi Arabia | 0.0 /100 | #339 | Tragic 60.7% |
| Immigrants | Sudan | 0.0 /100 | #340 | Tragic 60.2% |
| Immigrants | Senegal | 0.0 /100 | #341 | Tragic 60.1% |
| Sudanese | 0.0 /100 | #342 | Tragic 60.0% |
| Senegalese | 0.0 /100 | #343 | Tragic 59.8% |
| Immigrants | Congo | 0.0 /100 | #344 | Tragic 59.2% |
| Immigrants | Zaire | 0.0 /100 | #345 | Tragic 59.2% |
| Somalis | 0.0 /100 | #346 | Tragic 57.6% |
| Immigrants | Somalia | 0.0 /100 | #347 | Tragic 56.7% |
Demographics Similar to Immigrants from Czechoslovakia by Family Households
In terms of family households, the demographic groups most similar to Immigrants from Czechoslovakia are Immigrants from Israel (63.4%, a difference of 0.010%), Immigrants from St. Vincent and the Grenadines (63.4%, a difference of 0.020%), Aleut (63.4%, a difference of 0.030%), South African (63.4%, a difference of 0.030%), and Eastern European (63.4%, a difference of 0.030%).
| Demographics | Rating | Rank | Family Households |
| Ghanaians | 2.1 /100 | #236 | Tragic 63.5% |
| Comanche | 2.1 /100 | #237 | Tragic 63.5% |
| Immigrants | Zimbabwe | 2.0 /100 | #238 | Tragic 63.5% |
| Aleuts | 1.9 /100 | #239 | Tragic 63.4% |
| South Africans | 1.9 /100 | #240 | Tragic 63.4% |
| Immigrants | St. Vincent and the Grenadines | 1.9 /100 | #241 | Tragic 63.4% |
| Immigrants | Israel | 1.8 /100 | #242 | Tragic 63.4% |
| Immigrants | Czechoslovakia | 1.8 /100 | #243 | Tragic 63.4% |
| Eastern Europeans | 1.6 /100 | #244 | Tragic 63.4% |
| Immigrants | Dominica | 1.6 /100 | #245 | Tragic 63.4% |
| Immigrants | Ghana | 1.6 /100 | #246 | Tragic 63.4% |
| Immigrants | Uzbekistan | 1.5 /100 | #247 | Tragic 63.4% |
| Dominicans | 1.5 /100 | #248 | Tragic 63.4% |
| Russians | 1.4 /100 | #249 | Tragic 63.4% |
| Immigrants | Japan | 1.4 /100 | #250 | Tragic 63.4% |