Lumbee vs Immigrants from Czechoslovakia Family Households
COMPARE
Lumbee
Immigrants from Czechoslovakia
Family Households
Family Households Comparison
Lumbee
Immigrants from Czechoslovakia
63.1%
FAMILY HOUSEHOLDS
0.3/ 100
METRIC RATING
274th/ 347
METRIC RANK
63.4%
FAMILY HOUSEHOLDS
1.8/ 100
METRIC RATING
243rd/ 347
METRIC RANK
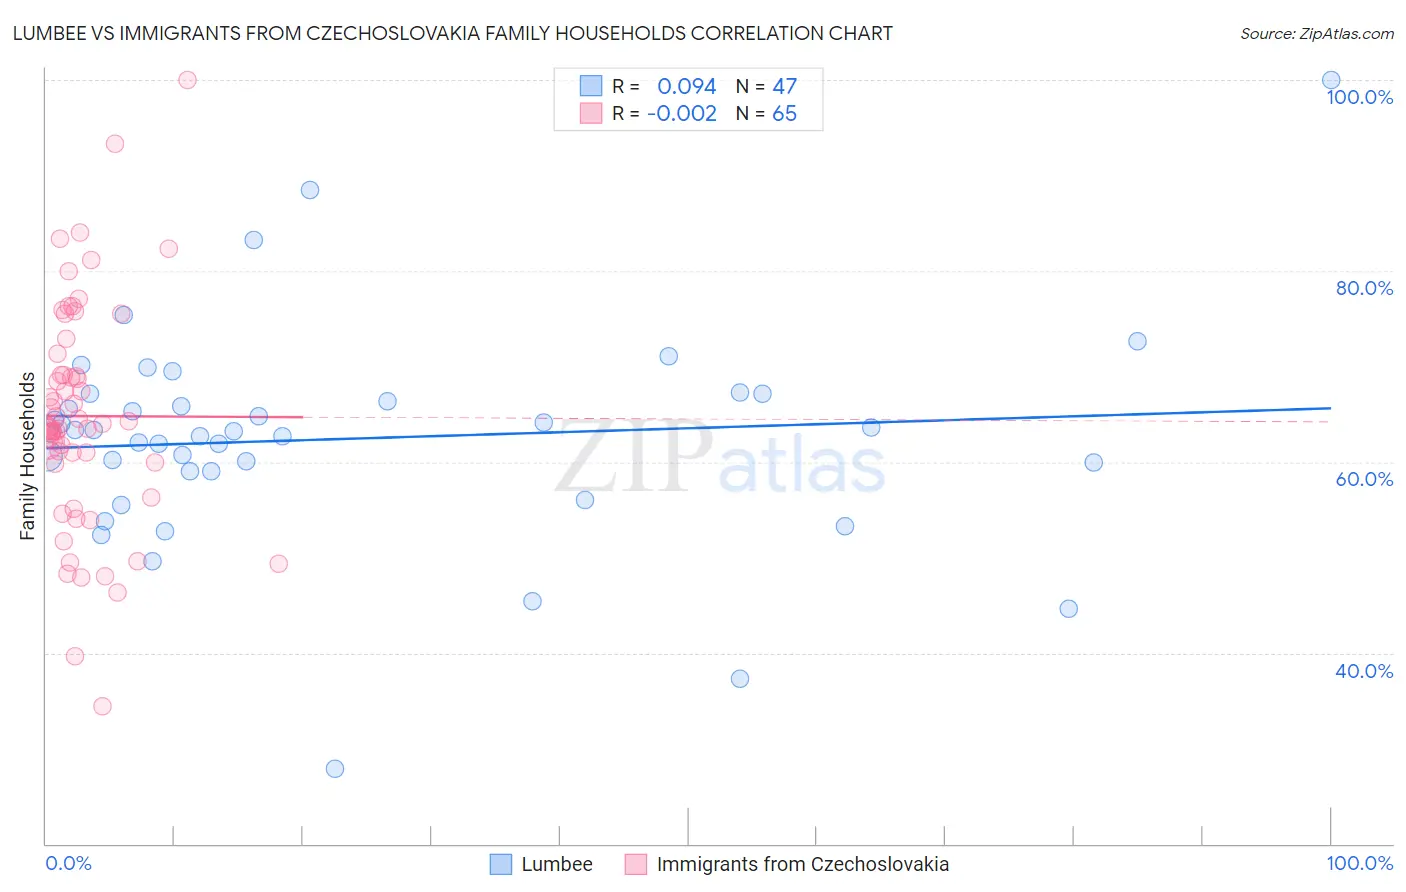
Lumbee vs Immigrants from Czechoslovakia Family Households Correlation Chart
The statistical analysis conducted on geographies consisting of 92,265,071 people shows a slight positive correlation between the proportion of Lumbee and percentage of family households in the United States with a correlation coefficient (R) of 0.094 and weighted average of 63.1%. Similarly, the statistical analysis conducted on geographies consisting of 195,445,494 people shows no correlation between the proportion of Immigrants from Czechoslovakia and percentage of family households in the United States with a correlation coefficient (R) of -0.002 and weighted average of 63.4%, a difference of 0.60%.
Family Households Correlation Summary
| Measurement | Lumbee | Immigrants from Czechoslovakia |
| Minimum | 27.9% | 34.4% |
| Maximum | 100.0% | 100.0% |
| Range | 72.1% | 65.6% |
| Mean | 62.4% | 64.8% |
| Median | 63.1% | 63.7% |
| Interquartile 25% (IQ1) | 59.0% | 59.9% |
| Interquartile 75% (IQ3) | 67.2% | 70.2% |
| Interquartile Range (IQR) | 8.2% | 10.4% |
| Standard Deviation (Sample) | 11.7% | 11.8% |
| Standard Deviation (Population) | 11.5% | 11.7% |
Similar Demographics by Family Households
Demographics Similar to Lumbee by Family Households
In terms of family households, the demographic groups most similar to Lumbee are West Indian (63.1%, a difference of 0.0%), Immigrants from Kazakhstan (63.1%, a difference of 0.010%), Serbian (63.0%, a difference of 0.010%), Immigrants from Croatia (63.1%, a difference of 0.020%), and Immigrants from Turkey (63.1%, a difference of 0.020%).
| Demographics | Rating | Rank | Family Households |
| Israelis | 0.4 /100 | #267 | Tragic 63.1% |
| Immigrants | Singapore | 0.4 /100 | #268 | Tragic 63.1% |
| Yugoslavians | 0.4 /100 | #269 | Tragic 63.1% |
| Immigrants | Austria | 0.3 /100 | #270 | Tragic 63.1% |
| Immigrants | Croatia | 0.3 /100 | #271 | Tragic 63.1% |
| Immigrants | Turkey | 0.3 /100 | #272 | Tragic 63.1% |
| Immigrants | Kazakhstan | 0.3 /100 | #273 | Tragic 63.1% |
| Lumbee | 0.3 /100 | #274 | Tragic 63.1% |
| West Indians | 0.3 /100 | #275 | Tragic 63.1% |
| Serbians | 0.3 /100 | #276 | Tragic 63.0% |
| Ottawa | 0.3 /100 | #277 | Tragic 63.0% |
| Immigrants | Belgium | 0.2 /100 | #278 | Tragic 63.0% |
| Immigrants | Yemen | 0.2 /100 | #279 | Tragic 63.0% |
| Immigrants | Bulgaria | 0.2 /100 | #280 | Tragic 63.0% |
| Estonians | 0.2 /100 | #281 | Tragic 62.9% |
Demographics Similar to Immigrants from Czechoslovakia by Family Households
In terms of family households, the demographic groups most similar to Immigrants from Czechoslovakia are Immigrants from Israel (63.4%, a difference of 0.010%), Immigrants from St. Vincent and the Grenadines (63.4%, a difference of 0.020%), Aleut (63.4%, a difference of 0.030%), South African (63.4%, a difference of 0.030%), and Eastern European (63.4%, a difference of 0.030%).
| Demographics | Rating | Rank | Family Households |
| Ghanaians | 2.1 /100 | #236 | Tragic 63.5% |
| Comanche | 2.1 /100 | #237 | Tragic 63.5% |
| Immigrants | Zimbabwe | 2.0 /100 | #238 | Tragic 63.5% |
| Aleuts | 1.9 /100 | #239 | Tragic 63.4% |
| South Africans | 1.9 /100 | #240 | Tragic 63.4% |
| Immigrants | St. Vincent and the Grenadines | 1.9 /100 | #241 | Tragic 63.4% |
| Immigrants | Israel | 1.8 /100 | #242 | Tragic 63.4% |
| Immigrants | Czechoslovakia | 1.8 /100 | #243 | Tragic 63.4% |
| Eastern Europeans | 1.6 /100 | #244 | Tragic 63.4% |
| Immigrants | Dominica | 1.6 /100 | #245 | Tragic 63.4% |
| Immigrants | Ghana | 1.6 /100 | #246 | Tragic 63.4% |
| Immigrants | Uzbekistan | 1.5 /100 | #247 | Tragic 63.4% |
| Dominicans | 1.5 /100 | #248 | Tragic 63.4% |
| Russians | 1.4 /100 | #249 | Tragic 63.4% |
| Immigrants | Japan | 1.4 /100 | #250 | Tragic 63.4% |