Puerto Rican vs Czech Married-couple Households
COMPARE
Puerto Rican
Czech
Married-couple Households
Married-couple Households Comparison
Puerto Ricans
Czechs
40.1%
MARRIED-COUPLE HOUSEHOLDS
0.0/ 100
METRIC RATING
323rd/ 347
METRIC RANK
49.4%
MARRIED-COUPLE HOUSEHOLDS
99.9/ 100
METRIC RATING
24th/ 347
METRIC RANK
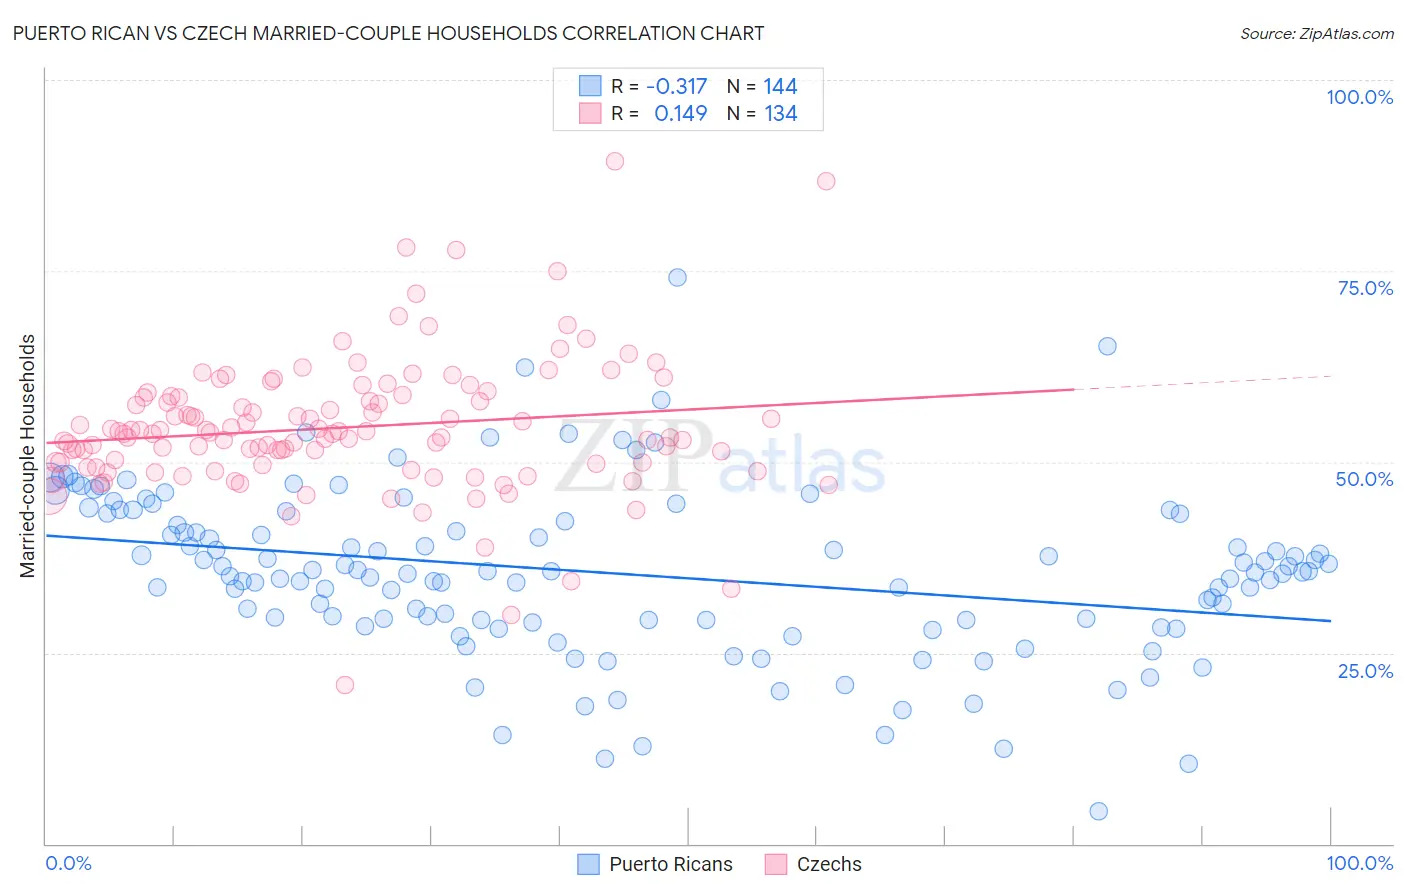
Puerto Rican vs Czech Married-couple Households Correlation Chart
The statistical analysis conducted on geographies consisting of 527,687,187 people shows a mild negative correlation between the proportion of Puerto Ricans and percentage of married-couple family households in the United States with a correlation coefficient (R) of -0.317 and weighted average of 40.1%. Similarly, the statistical analysis conducted on geographies consisting of 484,447,060 people shows a poor positive correlation between the proportion of Czechs and percentage of married-couple family households in the United States with a correlation coefficient (R) of 0.149 and weighted average of 49.4%, a difference of 23.4%.
Married-couple Households Correlation Summary
| Measurement | Puerto Rican | Czech |
| Minimum | 4.2% | 20.8% |
| Maximum | 74.1% | 89.3% |
| Range | 69.9% | 68.5% |
| Mean | 35.4% | 54.5% |
| Median | 35.6% | 53.7% |
| Interquartile 25% (IQ1) | 29.3% | 49.8% |
| Interquartile 75% (IQ3) | 42.7% | 58.5% |
| Interquartile Range (IQR) | 13.4% | 8.6% |
| Standard Deviation (Sample) | 11.0% | 9.0% |
| Standard Deviation (Population) | 11.0% | 9.0% |
Similar Demographics by Married-couple Households
Demographics Similar to Puerto Ricans by Married-couple Households
In terms of married-couple households, the demographic groups most similar to Puerto Ricans are Immigrants from Zaire (40.1%, a difference of 0.0%), Navajo (40.1%, a difference of 0.010%), Pueblo (40.0%, a difference of 0.24%), Immigrants from Liberia (40.3%, a difference of 0.66%), and West Indian (40.3%, a difference of 0.70%).
| Demographics | Rating | Rank | Married-couple Households |
| Immigrants | Caribbean | 0.0 /100 | #316 | Tragic 40.8% |
| Immigrants | Jamaica | 0.0 /100 | #317 | Tragic 40.7% |
| Liberians | 0.0 /100 | #318 | Tragic 40.7% |
| Bahamians | 0.0 /100 | #319 | Tragic 40.5% |
| West Indians | 0.0 /100 | #320 | Tragic 40.3% |
| Immigrants | Liberia | 0.0 /100 | #321 | Tragic 40.3% |
| Immigrants | Zaire | 0.0 /100 | #322 | Tragic 40.1% |
| Puerto Ricans | 0.0 /100 | #323 | Tragic 40.1% |
| Navajo | 0.0 /100 | #324 | Tragic 40.1% |
| Pueblo | 0.0 /100 | #325 | Tragic 40.0% |
| U.S. Virgin Islanders | 0.0 /100 | #326 | Tragic 39.8% |
| Lumbee | 0.0 /100 | #327 | Tragic 39.6% |
| Barbadians | 0.0 /100 | #328 | Tragic 39.4% |
| Immigrants | Dominica | 0.0 /100 | #329 | Tragic 39.4% |
| Immigrants | Barbados | 0.0 /100 | #330 | Tragic 39.2% |
Demographics Similar to Czechs by Married-couple Households
In terms of married-couple households, the demographic groups most similar to Czechs are Dutch (49.5%, a difference of 0.080%), Asian (49.5%, a difference of 0.090%), Immigrants from Philippines (49.3%, a difference of 0.19%), Norwegian (49.5%, a difference of 0.20%), and European (49.6%, a difference of 0.26%).
| Demographics | Rating | Rank | Married-couple Households |
| Immigrants | Hong Kong | 99.9 /100 | #17 | Exceptional 49.6% |
| English | 99.9 /100 | #18 | Exceptional 49.6% |
| Europeans | 99.9 /100 | #19 | Exceptional 49.6% |
| Scandinavians | 99.9 /100 | #20 | Exceptional 49.6% |
| Norwegians | 99.9 /100 | #21 | Exceptional 49.5% |
| Asians | 99.9 /100 | #22 | Exceptional 49.5% |
| Dutch | 99.9 /100 | #23 | Exceptional 49.5% |
| Czechs | 99.9 /100 | #24 | Exceptional 49.4% |
| Immigrants | Philippines | 99.9 /100 | #25 | Exceptional 49.3% |
| Immigrants | Scotland | 99.8 /100 | #26 | Exceptional 49.3% |
| Bhutanese | 99.8 /100 | #27 | Exceptional 49.3% |
| Germans | 99.8 /100 | #28 | Exceptional 49.2% |
| Maltese | 99.8 /100 | #29 | Exceptional 49.2% |
| Bolivians | 99.8 /100 | #30 | Exceptional 49.2% |
| Native Hawaiians | 99.8 /100 | #31 | Exceptional 49.1% |