Sierra Leonean vs Czech Hearing Disability
COMPARE
Sierra Leonean
Czech
Hearing Disability
Hearing Disability Comparison
Sierra Leoneans
Czechs
2.5%
HEARING DISABILITY
99.9/ 100
METRIC RATING
13th/ 347
METRIC RANK
3.5%
HEARING DISABILITY
0.1/ 100
METRIC RATING
271st/ 347
METRIC RANK
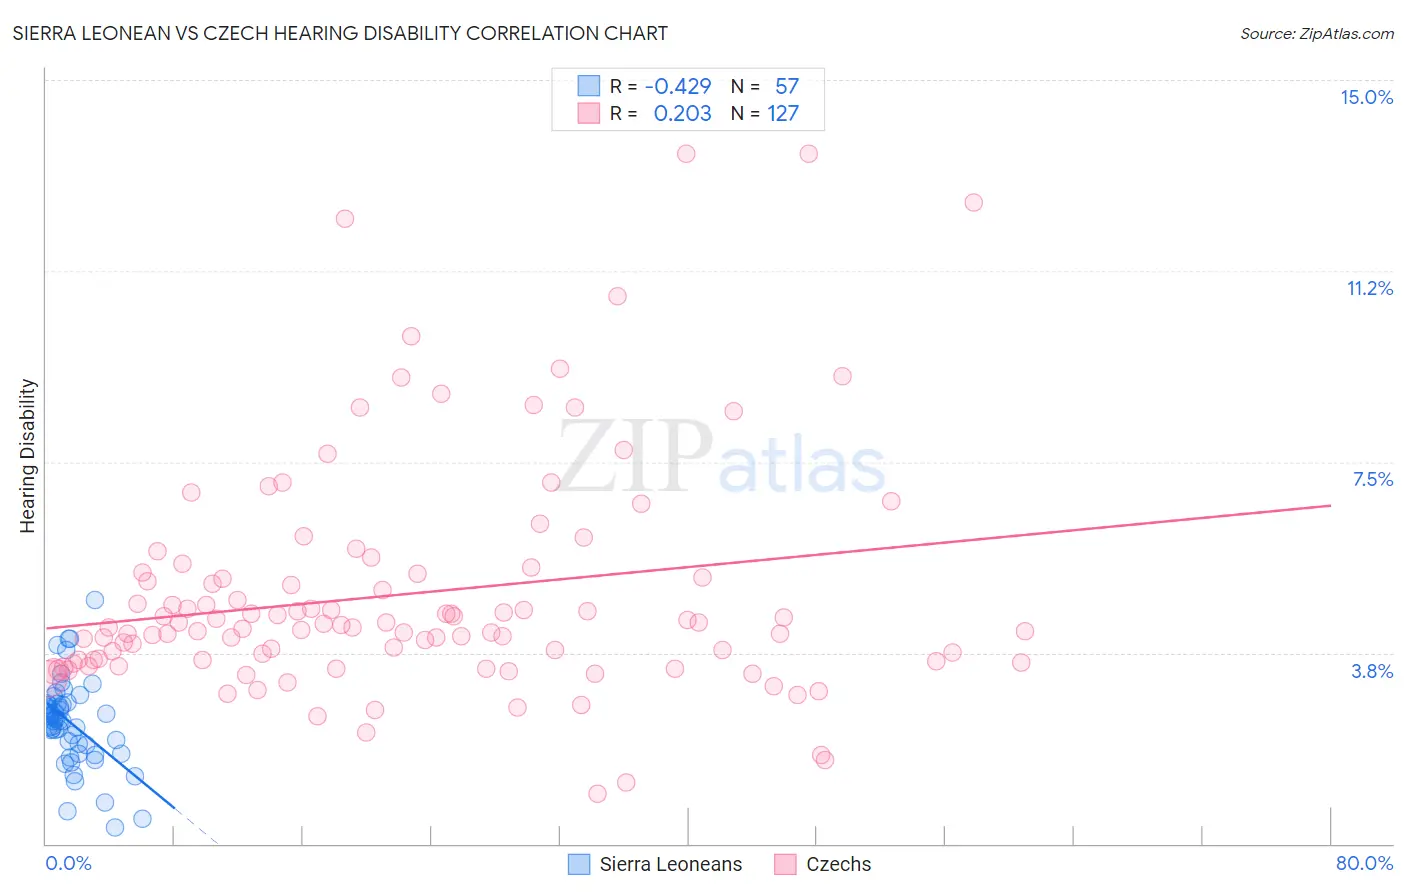
Sierra Leonean vs Czech Hearing Disability Correlation Chart
The statistical analysis conducted on geographies consisting of 83,339,030 people shows a moderate negative correlation between the proportion of Sierra Leoneans and percentage of population with hearing disability in the United States with a correlation coefficient (R) of -0.429 and weighted average of 2.5%. Similarly, the statistical analysis conducted on geographies consisting of 484,559,350 people shows a weak positive correlation between the proportion of Czechs and percentage of population with hearing disability in the United States with a correlation coefficient (R) of 0.203 and weighted average of 3.5%, a difference of 40.8%.
Hearing Disability Correlation Summary
| Measurement | Sierra Leonean | Czech |
| Minimum | 0.31% | 0.98% |
| Maximum | 4.8% | 13.6% |
| Range | 4.5% | 12.6% |
| Mean | 2.4% | 4.9% |
| Median | 2.4% | 4.3% |
| Interquartile 25% (IQ1) | 1.9% | 3.6% |
| Interquartile 75% (IQ3) | 2.8% | 5.3% |
| Interquartile Range (IQR) | 0.89% | 1.7% |
| Standard Deviation (Sample) | 0.86% | 2.3% |
| Standard Deviation (Population) | 0.85% | 2.3% |
Similar Demographics by Hearing Disability
Demographics Similar to Sierra Leoneans by Hearing Disability
In terms of hearing disability, the demographic groups most similar to Sierra Leoneans are Trinidadian and Tobagonian (2.5%, a difference of 0.22%), Ecuadorian (2.5%, a difference of 0.32%), Immigrants from Trinidad and Tobago (2.5%, a difference of 0.53%), Barbadian (2.5%, a difference of 0.62%), and Immigrants from West Indies (2.5%, a difference of 0.77%).
| Demographics | Rating | Rank | Hearing Disability |
| Vietnamese | 100.0 /100 | #6 | Exceptional 2.4% |
| Immigrants | Bangladesh | 100.0 /100 | #7 | Exceptional 2.4% |
| British West Indians | 100.0 /100 | #8 | Exceptional 2.4% |
| Immigrants | Dominican Republic | 100.0 /100 | #9 | Exceptional 2.4% |
| Immigrants | Ecuador | 99.9 /100 | #10 | Exceptional 2.5% |
| Immigrants | Trinidad and Tobago | 99.9 /100 | #11 | Exceptional 2.5% |
| Trinidadians and Tobagonians | 99.9 /100 | #12 | Exceptional 2.5% |
| Sierra Leoneans | 99.9 /100 | #13 | Exceptional 2.5% |
| Ecuadorians | 99.9 /100 | #14 | Exceptional 2.5% |
| Barbadians | 99.9 /100 | #15 | Exceptional 2.5% |
| Immigrants | West Indies | 99.9 /100 | #16 | Exceptional 2.5% |
| Immigrants | India | 99.9 /100 | #17 | Exceptional 2.5% |
| Dominicans | 99.8 /100 | #18 | Exceptional 2.5% |
| Thais | 99.8 /100 | #19 | Exceptional 2.5% |
| Immigrants | Bolivia | 99.8 /100 | #20 | Exceptional 2.5% |
Demographics Similar to Czechs by Hearing Disability
In terms of hearing disability, the demographic groups most similar to Czechs are European (3.5%, a difference of 0.26%), Fijian (3.5%, a difference of 0.26%), Puerto Rican (3.5%, a difference of 0.33%), Ute (3.5%, a difference of 0.61%), and Swiss (3.5%, a difference of 0.66%).
| Demographics | Rating | Rank | Hearing Disability |
| Immigrants | Germany | 0.1 /100 | #264 | Tragic 3.5% |
| British | 0.1 /100 | #265 | Tragic 3.5% |
| Belgians | 0.1 /100 | #266 | Tragic 3.5% |
| Canadians | 0.1 /100 | #267 | Tragic 3.5% |
| Spaniards | 0.1 /100 | #268 | Tragic 3.5% |
| Ute | 0.1 /100 | #269 | Tragic 3.5% |
| Europeans | 0.1 /100 | #270 | Tragic 3.5% |
| Czechs | 0.1 /100 | #271 | Tragic 3.5% |
| Fijians | 0.0 /100 | #272 | Tragic 3.5% |
| Puerto Ricans | 0.0 /100 | #273 | Tragic 3.5% |
| Swiss | 0.0 /100 | #274 | Tragic 3.5% |
| Czechoslovakians | 0.0 /100 | #275 | Tragic 3.6% |
| Danes | 0.0 /100 | #276 | Tragic 3.6% |
| Immigrants | Nonimmigrants | 0.0 /100 | #277 | Tragic 3.6% |
| Basques | 0.0 /100 | #278 | Tragic 3.6% |