Immigrants from Guyana vs Immigrants from Cuba Family Households
COMPARE
Immigrants from Guyana
Immigrants from Cuba
Family Households
Family Households Comparison
Immigrants from Guyana
Immigrants from Cuba
65.5%
FAMILY HOUSEHOLDS
99.6/ 100
METRIC RATING
83rd/ 347
METRIC RANK
68.2%
FAMILY HOUSEHOLDS
100.0/ 100
METRIC RATING
14th/ 347
METRIC RANK
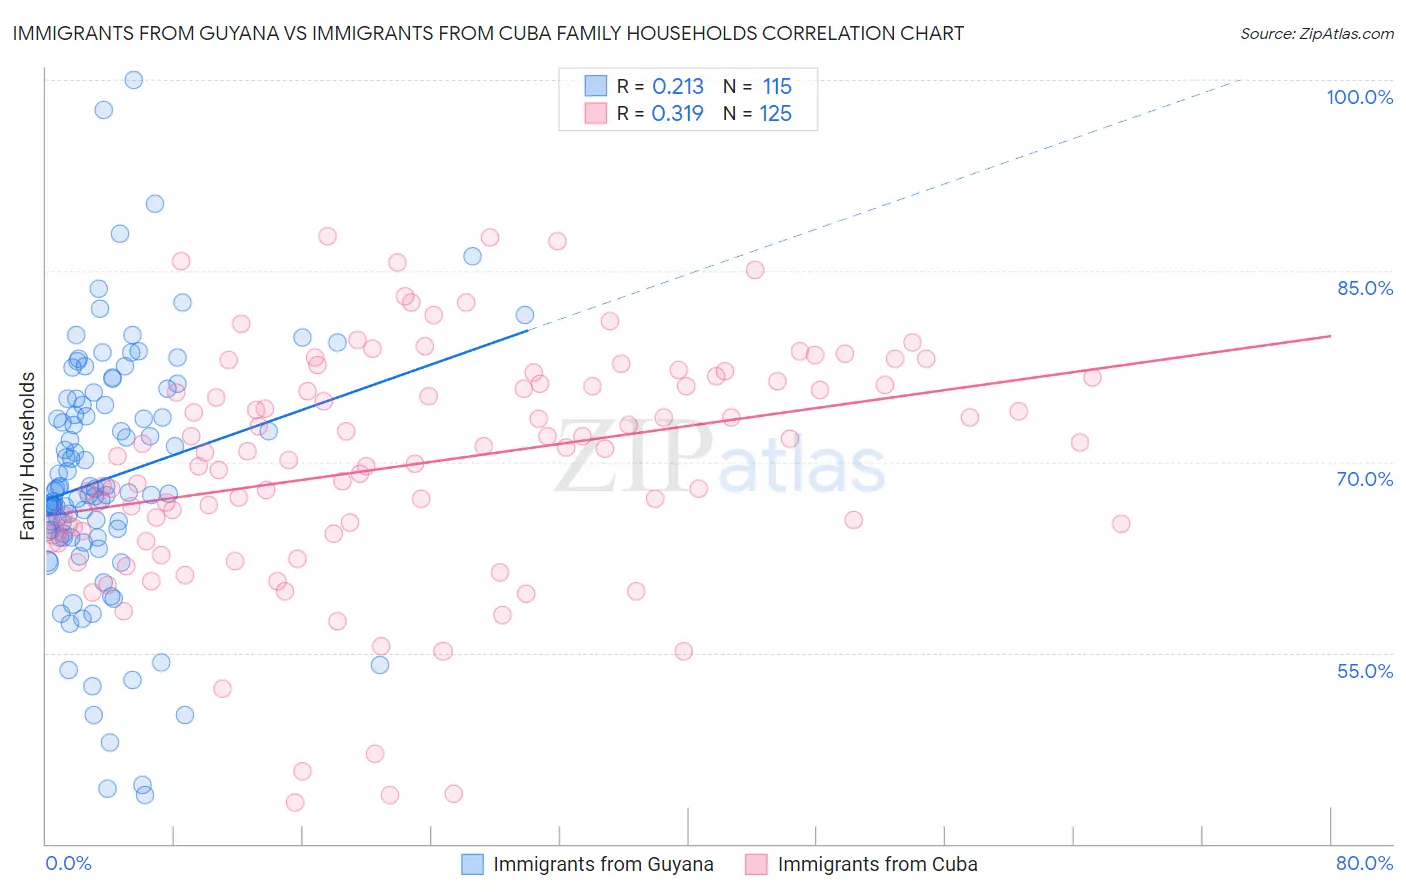
Immigrants from Guyana vs Immigrants from Cuba Family Households Correlation Chart
The statistical analysis conducted on geographies consisting of 183,692,890 people shows a weak positive correlation between the proportion of Immigrants from Guyana and percentage of family households in the United States with a correlation coefficient (R) of 0.213 and weighted average of 65.5%. Similarly, the statistical analysis conducted on geographies consisting of 325,966,420 people shows a mild positive correlation between the proportion of Immigrants from Cuba and percentage of family households in the United States with a correlation coefficient (R) of 0.319 and weighted average of 68.2%, a difference of 4.1%.
Family Households Correlation Summary
| Measurement | Immigrants from Guyana | Immigrants from Cuba |
| Minimum | 43.8% | 43.2% |
| Maximum | 100.0% | 87.7% |
| Range | 56.2% | 44.5% |
| Mean | 68.8% | 69.8% |
| Median | 67.6% | 70.8% |
| Interquartile 25% (IQ1) | 64.1% | 64.5% |
| Interquartile 75% (IQ3) | 74.9% | 76.2% |
| Interquartile Range (IQR) | 10.8% | 11.8% |
| Standard Deviation (Sample) | 9.8% | 9.2% |
| Standard Deviation (Population) | 9.8% | 9.1% |
Similar Demographics by Family Households
Demographics Similar to Immigrants from Guyana by Family Households
In terms of family households, the demographic groups most similar to Immigrants from Guyana are Immigrants from Lebanon (65.5%, a difference of 0.010%), American (65.5%, a difference of 0.020%), Jordanian (65.5%, a difference of 0.040%), Puget Sound Salish (65.6%, a difference of 0.13%), and Immigrants from Cambodia (65.4%, a difference of 0.13%).
| Demographics | Rating | Rank | Family Households |
| Immigrants | Azores | 99.8 /100 | #76 | Exceptional 65.6% |
| Immigrants | South America | 99.8 /100 | #77 | Exceptional 65.6% |
| Yaqui | 99.8 /100 | #78 | Exceptional 65.6% |
| Immigrants | Costa Rica | 99.8 /100 | #79 | Exceptional 65.6% |
| Puget Sound Salish | 99.8 /100 | #80 | Exceptional 65.6% |
| Jordanians | 99.7 /100 | #81 | Exceptional 65.5% |
| Immigrants | Lebanon | 99.7 /100 | #82 | Exceptional 65.5% |
| Immigrants | Guyana | 99.6 /100 | #83 | Exceptional 65.5% |
| Americans | 99.6 /100 | #84 | Exceptional 65.5% |
| Immigrants | Cambodia | 99.5 /100 | #85 | Exceptional 65.4% |
| Egyptians | 99.4 /100 | #86 | Exceptional 65.4% |
| Immigrants | Egypt | 99.2 /100 | #87 | Exceptional 65.3% |
| Immigrants | Haiti | 99.1 /100 | #88 | Exceptional 65.3% |
| Immigrants | Caribbean | 99.1 /100 | #89 | Exceptional 65.3% |
| Immigrants | Laos | 99.1 /100 | #90 | Exceptional 65.3% |
Demographics Similar to Immigrants from Cuba by Family Households
In terms of family households, the demographic groups most similar to Immigrants from Cuba are Pueblo (68.2%, a difference of 0.010%), Assyrian/Chaldean/Syriac (68.2%, a difference of 0.060%), Immigrants from Vietnam (68.2%, a difference of 0.060%), Korean (68.3%, a difference of 0.090%), and Chinese (68.1%, a difference of 0.10%).
| Demographics | Rating | Rank | Family Households |
| Mexicans | 100.0 /100 | #7 | Exceptional 69.0% |
| Immigrants | Fiji | 100.0 /100 | #8 | Exceptional 68.8% |
| Native Hawaiians | 100.0 /100 | #9 | Exceptional 68.4% |
| Immigrants | Philippines | 100.0 /100 | #10 | Exceptional 68.3% |
| Immigrants | Central America | 100.0 /100 | #11 | Exceptional 68.3% |
| Koreans | 100.0 /100 | #12 | Exceptional 68.3% |
| Pueblo | 100.0 /100 | #13 | Exceptional 68.2% |
| Immigrants | Cuba | 100.0 /100 | #14 | Exceptional 68.2% |
| Assyrians/Chaldeans/Syriacs | 100.0 /100 | #15 | Exceptional 68.2% |
| Immigrants | Vietnam | 100.0 /100 | #16 | Exceptional 68.2% |
| Chinese | 100.0 /100 | #17 | Exceptional 68.1% |
| Immigrants | Taiwan | 100.0 /100 | #18 | Exceptional 68.0% |
| Samoans | 100.0 /100 | #19 | Exceptional 67.9% |
| Inupiat | 100.0 /100 | #20 | Exceptional 67.8% |
| Cubans | 100.0 /100 | #21 | Exceptional 67.7% |