Spaniard vs Immigrants from Cuba Family Households
COMPARE
Spaniard
Immigrants from Cuba
Family Households
Family Households Comparison
Spaniards
Immigrants from Cuba
65.1%
FAMILY HOUSEHOLDS
97.8/ 100
METRIC RATING
104th/ 347
METRIC RANK
68.2%
FAMILY HOUSEHOLDS
100.0/ 100
METRIC RATING
14th/ 347
METRIC RANK
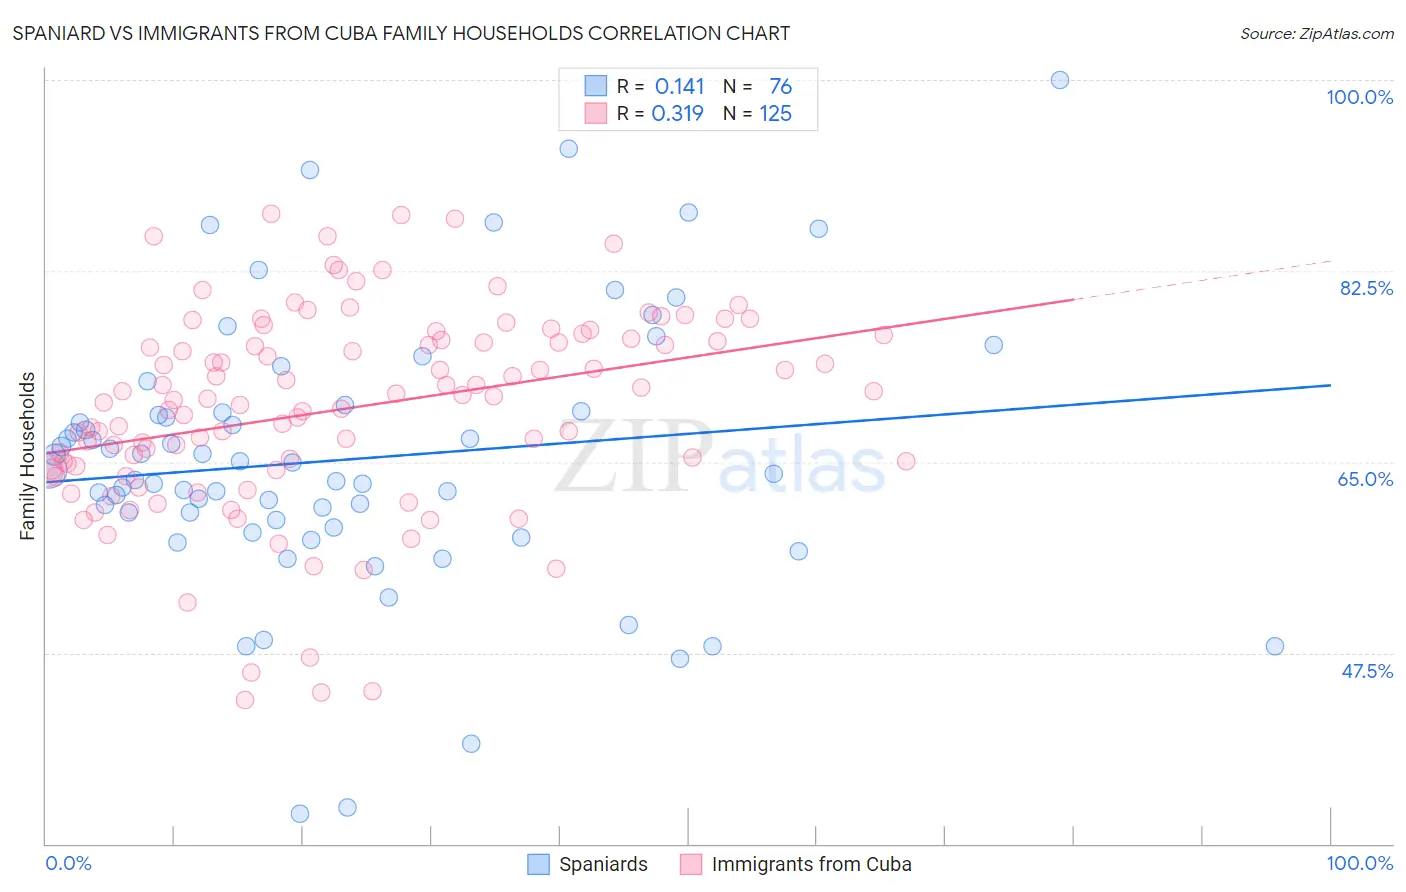
Spaniard vs Immigrants from Cuba Family Households Correlation Chart
The statistical analysis conducted on geographies consisting of 443,170,610 people shows a poor positive correlation between the proportion of Spaniards and percentage of family households in the United States with a correlation coefficient (R) of 0.141 and weighted average of 65.1%. Similarly, the statistical analysis conducted on geographies consisting of 325,966,420 people shows a mild positive correlation between the proportion of Immigrants from Cuba and percentage of family households in the United States with a correlation coefficient (R) of 0.319 and weighted average of 68.2%, a difference of 4.7%.
Family Households Correlation Summary
| Measurement | Spaniard | Immigrants from Cuba |
| Minimum | 32.8% | 43.2% |
| Maximum | 100.0% | 87.7% |
| Range | 67.2% | 44.5% |
| Mean | 65.2% | 69.8% |
| Median | 64.1% | 70.8% |
| Interquartile 25% (IQ1) | 59.3% | 64.5% |
| Interquartile 75% (IQ3) | 69.6% | 76.2% |
| Interquartile Range (IQR) | 10.3% | 11.8% |
| Standard Deviation (Sample) | 12.5% | 9.2% |
| Standard Deviation (Population) | 12.4% | 9.1% |
Similar Demographics by Family Households
Demographics Similar to Spaniards by Family Households
In terms of family households, the demographic groups most similar to Spaniards are Indian (Asian) (65.1%, a difference of 0.010%), Immigrants from Sri Lanka (65.1%, a difference of 0.020%), Haitian (65.2%, a difference of 0.040%), Chilean (65.2%, a difference of 0.040%), and English (65.1%, a difference of 0.070%).
| Demographics | Rating | Rank | Family Households |
| Guatemalans | 98.6 /100 | #97 | Exceptional 65.2% |
| Immigrants | Syria | 98.4 /100 | #98 | Exceptional 65.2% |
| Central American Indians | 98.3 /100 | #99 | Exceptional 65.2% |
| Haitians | 98.1 /100 | #100 | Exceptional 65.2% |
| Chileans | 98.1 /100 | #101 | Exceptional 65.2% |
| Immigrants | Sri Lanka | 98.0 /100 | #102 | Exceptional 65.1% |
| Indians (Asian) | 97.9 /100 | #103 | Exceptional 65.1% |
| Spaniards | 97.8 /100 | #104 | Exceptional 65.1% |
| English | 97.4 /100 | #105 | Exceptional 65.1% |
| Whites/Caucasians | 97.3 /100 | #106 | Exceptional 65.1% |
| Alaska Natives | 97.3 /100 | #107 | Exceptional 65.1% |
| Palestinians | 97.2 /100 | #108 | Exceptional 65.1% |
| Immigrants | Guatemala | 96.9 /100 | #109 | Exceptional 65.0% |
| Scandinavians | 96.8 /100 | #110 | Exceptional 65.0% |
| Europeans | 96.8 /100 | #111 | Exceptional 65.0% |
Demographics Similar to Immigrants from Cuba by Family Households
In terms of family households, the demographic groups most similar to Immigrants from Cuba are Pueblo (68.2%, a difference of 0.010%), Assyrian/Chaldean/Syriac (68.2%, a difference of 0.060%), Immigrants from Vietnam (68.2%, a difference of 0.060%), Korean (68.3%, a difference of 0.090%), and Chinese (68.1%, a difference of 0.10%).
| Demographics | Rating | Rank | Family Households |
| Mexicans | 100.0 /100 | #7 | Exceptional 69.0% |
| Immigrants | Fiji | 100.0 /100 | #8 | Exceptional 68.8% |
| Native Hawaiians | 100.0 /100 | #9 | Exceptional 68.4% |
| Immigrants | Philippines | 100.0 /100 | #10 | Exceptional 68.3% |
| Immigrants | Central America | 100.0 /100 | #11 | Exceptional 68.3% |
| Koreans | 100.0 /100 | #12 | Exceptional 68.3% |
| Pueblo | 100.0 /100 | #13 | Exceptional 68.2% |
| Immigrants | Cuba | 100.0 /100 | #14 | Exceptional 68.2% |
| Assyrians/Chaldeans/Syriacs | 100.0 /100 | #15 | Exceptional 68.2% |
| Immigrants | Vietnam | 100.0 /100 | #16 | Exceptional 68.2% |
| Chinese | 100.0 /100 | #17 | Exceptional 68.1% |
| Immigrants | Taiwan | 100.0 /100 | #18 | Exceptional 68.0% |
| Samoans | 100.0 /100 | #19 | Exceptional 67.9% |
| Inupiat | 100.0 /100 | #20 | Exceptional 67.8% |
| Cubans | 100.0 /100 | #21 | Exceptional 67.7% |