Honduran vs Immigrants from Cuba Family Households

COMPARE

Honduran
Race
Ancestry
AfghanAfricanAlaska NativeAlaskan AthabascanAlbanianAleutAlsatianAmericanApacheArabArapahoArgentineanArmenianAssyrian/Chaldean/SyriacAustralianAustrianBahamianBangladeshiBarbadianBasqueBelgianBelizeanBermudanBhutaneseBlackfeetBolivianBrazilianBritishBritish West IndianBulgarianBurmeseCajunCambodianCanadianCape VerdeanCarpatho RusynCelticCentral AmericanCentral American IndianCherokeeCheyenneChickasawChileanChineseChippewaChoctawColombianColvilleComancheCosta RicanCreeCreekCroatianCrowCubanCypriotCzechCzechoslovakianDanishDelawareDominicanDutchDutch West IndianEastern EuropeanEcuadorianEgyptianEnglishEstonianEthiopianEuropeanFijianFilipinoFinnishFrenchFrench American IndianFrench CanadianGermanGerman RussianGhanaianGreekGuamanian/ChamorroGuatemalanGuyaneseHaitianHmongHonduranHopiHoumaHungarianIcelanderIndian (Asian)IndonesianInupiatIranianIraqiIrishIroquoisIsraeliItalianJamaicanJapaneseJordanianKenyanKiowaKoreanLaotianLatvianLebaneseLiberianLithuanianLumbeeLuxembourgerMacedonianMalaysianMalteseMarshalleseMenomineeMexicanMexican American IndianMongolianMoroccanNative HawaiianNavajoNepaleseNew ZealanderNicaraguanNigerianNorthern EuropeanNorwegianOkinawanOsageOttawaPaiutePakistaniPalestinianPanamanianParaguayanPennsylvania GermanPeruvianPimaPolishPortuguesePotawatomiPuebloPuerto RicanPuget Sound SalishRomanianRussianSalvadoranSamoanScandinavianScotch-IrishScottishSeminoleSenegaleseSerbianShoshoneSierra LeoneanSiouxSlavicSlovakSloveneSomaliSouth AfricanSouth AmericanSouth American IndianSoviet UnionSpaniardSpanishSpanish AmericanSpanish American IndianSri LankanSubsaharan AfricanSudaneseSwedishSwissSyrianTaiwaneseThaiTlingit-HaidaTohono O'OdhamTonganTrinidadian and TobagonianTsimshianTurkishU.S. Virgin IslanderUgandanUkrainianUruguayanUteVenezuelanVietnameseWelshWest IndianYakamaYaquiYugoslavianYumanYup'ikZimbabwean
Immigration
NonimmigrantsImmigrantsAfghanistanAfricaAlbaniaArgentinaArmeniaAsiaAustraliaAustriaBahamasBangladeshBarbadosBelarusBelgiumBelizeBoliviaBosnia and HerzegovinaBrazilBulgariaBurma/MyanmarCabo VerdeCambodiaCameroonCanadaCaribbeanCentral AmericaChileChinaColombiaCongoCosta RicaCroatiaCzechoslovakiaDenmarkDominicaDominican RepublicEastern AfricaEastern AsiaEastern EuropeEcuadorEgyptEl SalvadorEnglandEritreaEthiopiaEuropeFijiFranceGermanyGhanaGreeceGrenadaGuatemalaGuyanaHaitiHondurasHong KongHungaryIndiaIndonesiaIranIraqIrelandIsraelItalyJamaicaJapanJordanKazakhstanKenyaKoreaKuwaitLaosLatin AmericaLatviaLebanonLiberiaLithuaniaMalaysiaMexicoMicronesiaMiddle AfricaMoldovaMoroccoNepalNetherlandsNicaraguaNigeriaNorth AmericaNorth MacedoniaNorthern AfricaNorthern EuropeNorwayOceaniaPakistanPanamaPeruPhilippinesPolandPortugalRomaniaRussiaSaudi ArabiaScotlandSenegalSerbiaSierra LeoneSingaporeSomaliaSouth AfricaSouth AmericaSouth Central AsiaSouth Eastern AsiaSouthern EuropeSpainSri LankaSt. Vincent and the GrenadinesSudanSwedenSwitzerlandSyriaTaiwanThailandTrinidad and TobagoTurkeyUgandaUkraineUruguayUzbekistanVenezuelaVietnamWest IndiesWestern AfricaWestern AsiaWestern EuropeYemenZaireZimbabweAzores
Immigrants from Cuba
Race
Ancestry
AfghanAfricanAlaska NativeAlaskan AthabascanAlbanianAleutAlsatianAmericanApacheArabArapahoArgentineanArmenianAssyrian/Chaldean/SyriacAustralianAustrianBahamianBangladeshiBarbadianBasqueBelgianBelizeanBermudanBhutaneseBlackfeetBolivianBrazilianBritishBritish West IndianBulgarianBurmeseCajunCambodianCanadianCape VerdeanCarpatho RusynCelticCentral AmericanCentral American IndianCherokeeCheyenneChickasawChileanChineseChippewaChoctawColombianColvilleComancheCosta RicanCreeCreekCroatianCrowCubanCypriotCzechCzechoslovakianDanishDelawareDominicanDutchDutch West IndianEastern EuropeanEcuadorianEgyptianEnglishEstonianEthiopianEuropeanFijianFilipinoFinnishFrenchFrench American IndianFrench CanadianGermanGerman RussianGhanaianGreekGuamanian/ChamorroGuatemalanGuyaneseHaitianHmongHopiHoumaHungarianIcelanderIndian (Asian)IndonesianInupiatIranianIraqiIrishIroquoisIsraeliItalianJamaicanJapaneseJordanianKenyanKiowaKoreanLaotianLatvianLebaneseLiberianLithuanianLumbeeLuxembourgerMacedonianMalaysianMalteseMarshalleseMenomineeMexicanMexican American IndianMongolianMoroccanNative HawaiianNavajoNepaleseNew ZealanderNicaraguanNigerianNorthern EuropeanNorwegianOkinawanOsageOttawaPaiutePakistaniPalestinianPanamanianParaguayanPennsylvania GermanPeruvianPimaPolishPortuguesePotawatomiPuebloPuerto RicanPuget Sound SalishRomanianRussianSalvadoranSamoanScandinavianScotch-IrishScottishSeminoleSenegaleseSerbianShoshoneSierra LeoneanSiouxSlavicSlovakSloveneSomaliSouth AfricanSouth AmericanSouth American IndianSoviet UnionSpaniardSpanishSpanish AmericanSpanish American IndianSri LankanSubsaharan AfricanSudaneseSwedishSwissSyrianTaiwaneseThaiTlingit-HaidaTohono O'OdhamTonganTrinidadian and TobagonianTsimshianTurkishU.S. Virgin IslanderUgandanUkrainianUruguayanUteVenezuelanVietnameseWelshWest IndianYakamaYaquiYugoslavianYumanYup'ikZimbabwean
Immigration
NonimmigrantsImmigrantsAfghanistanAfricaAlbaniaArgentinaArmeniaAsiaAustraliaAustriaBahamasBangladeshBarbadosBelarusBelgiumBelizeBoliviaBosnia and HerzegovinaBrazilBulgariaBurma/MyanmarCabo VerdeCambodiaCameroonCanadaCaribbeanCentral AmericaChileChinaColombiaCongoCosta RicaCroatiaCubaCzechoslovakiaDenmarkDominicaDominican RepublicEastern AfricaEastern AsiaEastern EuropeEcuadorEgyptEl SalvadorEnglandEritreaEthiopiaEuropeFijiFranceGermanyGhanaGreeceGrenadaGuatemalaGuyanaHaitiHondurasHong KongHungaryIndiaIndonesiaIranIraqIrelandIsraelItalyJamaicaJapanJordanKazakhstanKenyaKoreaKuwaitLaosLatin AmericaLatviaLebanonLiberiaLithuaniaMalaysiaMexicoMicronesiaMiddle AfricaMoldovaMoroccoNepalNetherlandsNicaraguaNigeriaNorth AmericaNorth MacedoniaNorthern AfricaNorthern EuropeNorwayOceaniaPakistanPanamaPeruPhilippinesPolandPortugalRomaniaRussiaSaudi ArabiaScotlandSenegalSerbiaSierra LeoneSingaporeSomaliaSouth AfricaSouth AmericaSouth Central AsiaSouth Eastern AsiaSouthern EuropeSpainSri LankaSt. Vincent and the GrenadinesSudanSwedenSwitzerlandSyriaTaiwanThailandTrinidad and TobagoTurkeyUgandaUkraineUruguayUzbekistanVenezuelaVietnamWest IndiesWestern AfricaWestern AsiaWestern EuropeYemenZaireZimbabweAzores
Family Households
Income
Poverty
Unemployment
Labor Participation
Family Structure
Vehicle Availability
Education Level
Disability

Family Households Comparison

Hondurans

Immigrants from Cuba

Average
Exceptional
64.4%
FAMILY HOUSEHOLDS
57.5/ 100
METRIC RATING
168th/ 347
METRIC RANK
68.2%
FAMILY HOUSEHOLDS
100.0/ 100
METRIC RATING
14th/ 347
METRIC RANK

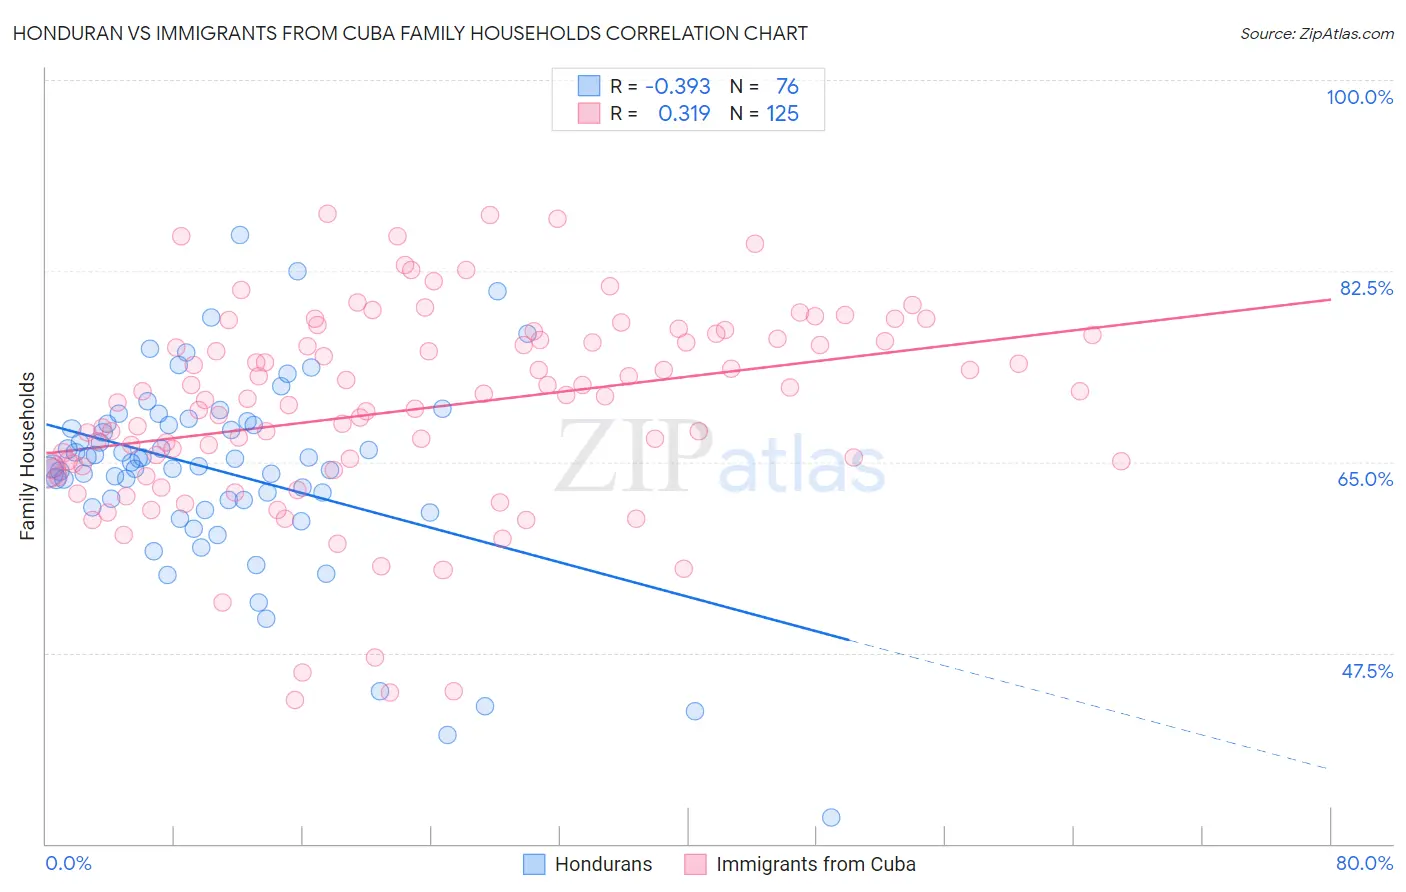
Honduran vs Immigrants from Cuba Family Households Correlation Chart

The statistical analysis conducted on geographies consisting of 357,606,635 people shows a mild negative correlation between the proportion of Hondurans and percentage of family households in the United States with a correlation coefficient (R) of -0.393 and weighted average of 64.4%. Similarly, the statistical analysis conducted on geographies consisting of 325,966,420 people shows a mild positive correlation between the proportion of Immigrants from Cuba and percentage of family households in the United States with a correlation coefficient (R) of 0.319 and weighted average of 68.2%, a difference of 6.0%.
Honduran vs Immigrants from Cuba Family Households

Family Households Correlation Summary

MeasurementHonduranImmigrants from Cuba
Minimum32.4%43.2%
Maximum85.8%87.7%
Range53.5%44.5%
Mean64.1%69.8%
Median64.8%70.8%
Interquartile 25% (IQ1)61.2%64.5%
Interquartile 75% (IQ3)68.5%76.2%
Interquartile Range (IQR)7.3%11.8%
Standard Deviation (Sample)9.1%9.2%
Standard Deviation (Population)9.0%9.1%

Similar Demographics by Family Households

Demographics Similar to Hondurans by Family Households

In terms of family households, the demographic groups most similar to Hondurans are Irish (64.4%, a difference of 0.010%), Scotch-Irish (64.4%, a difference of 0.020%), Iraqi (64.4%, a difference of 0.020%), Armenian (64.4%, a difference of 0.020%), and Immigrants from Nigeria (64.4%, a difference of 0.040%).
DemographicsRating | RankFamily Households
Immigrants | England
62.6
/100
|
#161
Good
64.4%
British
61.6
/100
|
#162
Good
64.4%
Chickasaw
61.5
/100
|
#163
Good
64.4%
Immigrants | Nigeria
60.1
/100
|
#164
Good
64.4%
Immigrants | Southern Europe
60.0
/100
|
#165
Good
64.4%
Scotch-Irish
59.2
/100
|
#166
Average
64.4%
Irish
57.9
/100
|
#167
Average
64.4%
Hondurans
57.5
/100
|
#168
Average
64.4%
Iraqis
56.0
/100
|
#169
Average
64.4%
Armenians
55.9
/100
|
#170
Average
64.4%
Ute
54.6
/100
|
#171
Average
64.3%
Dutch West Indians
53.9
/100
|
#172
Average
64.3%
Immigrants | Sierra Leone
52.5
/100
|
#173
Average
64.3%
Immigrants | Germany
50.0
/100
|
#174
Average
64.3%
Bangladeshis
44.3
/100
|
#175
Average
64.3%

Demographics Similar to Immigrants from Cuba by Family Households

In terms of family households, the demographic groups most similar to Immigrants from Cuba are Pueblo (68.2%, a difference of 0.010%), Assyrian/Chaldean/Syriac (68.2%, a difference of 0.060%), Immigrants from Vietnam (68.2%, a difference of 0.060%), Korean (68.3%, a difference of 0.090%), and Chinese (68.1%, a difference of 0.10%).
DemographicsRating | RankFamily Households
Mexicans
100.0
/100
|
#7
Exceptional
69.0%
Immigrants | Fiji
100.0
/100
|
#8
Exceptional
68.8%
Native Hawaiians
100.0
/100
|
#9
Exceptional
68.4%
Immigrants | Philippines
100.0
/100
|
#10
Exceptional
68.3%
Immigrants | Central America
100.0
/100
|
#11
Exceptional
68.3%
Koreans
100.0
/100
|
#12
Exceptional
68.3%
Pueblo
100.0
/100
|
#13
Exceptional
68.2%
Immigrants | Cuba
100.0
/100
|
#14
Exceptional
68.2%
Assyrians/Chaldeans/Syriacs
100.0
/100
|
#15
Exceptional
68.2%
Immigrants | Vietnam
100.0
/100
|
#16
Exceptional
68.2%
Chinese
100.0
/100
|
#17
Exceptional
68.1%
Immigrants | Taiwan
100.0
/100
|
#18
Exceptional
68.0%
Samoans
100.0
/100
|
#19
Exceptional
67.9%
Inupiat
100.0
/100
|
#20
Exceptional
67.8%
Cubans
100.0
/100
|
#21
Exceptional
67.7%