Senegalese vs Nonimmigrants In Labor Force | Age 16-19
COMPARE
Senegalese
Nonimmigrants
In Labor Force | Age 16-19
In Labor Force | Age 16-19 Comparison
Senegalese
Nonimmigrants
35.9%
IN LABOR FORCE | AGE 16-19
17.4/ 100
METRIC RATING
202nd/ 347
METRIC RANK
40.1%
IN LABOR FORCE | AGE 16-19
100.0/ 100
METRIC RATING
66th/ 347
METRIC RANK
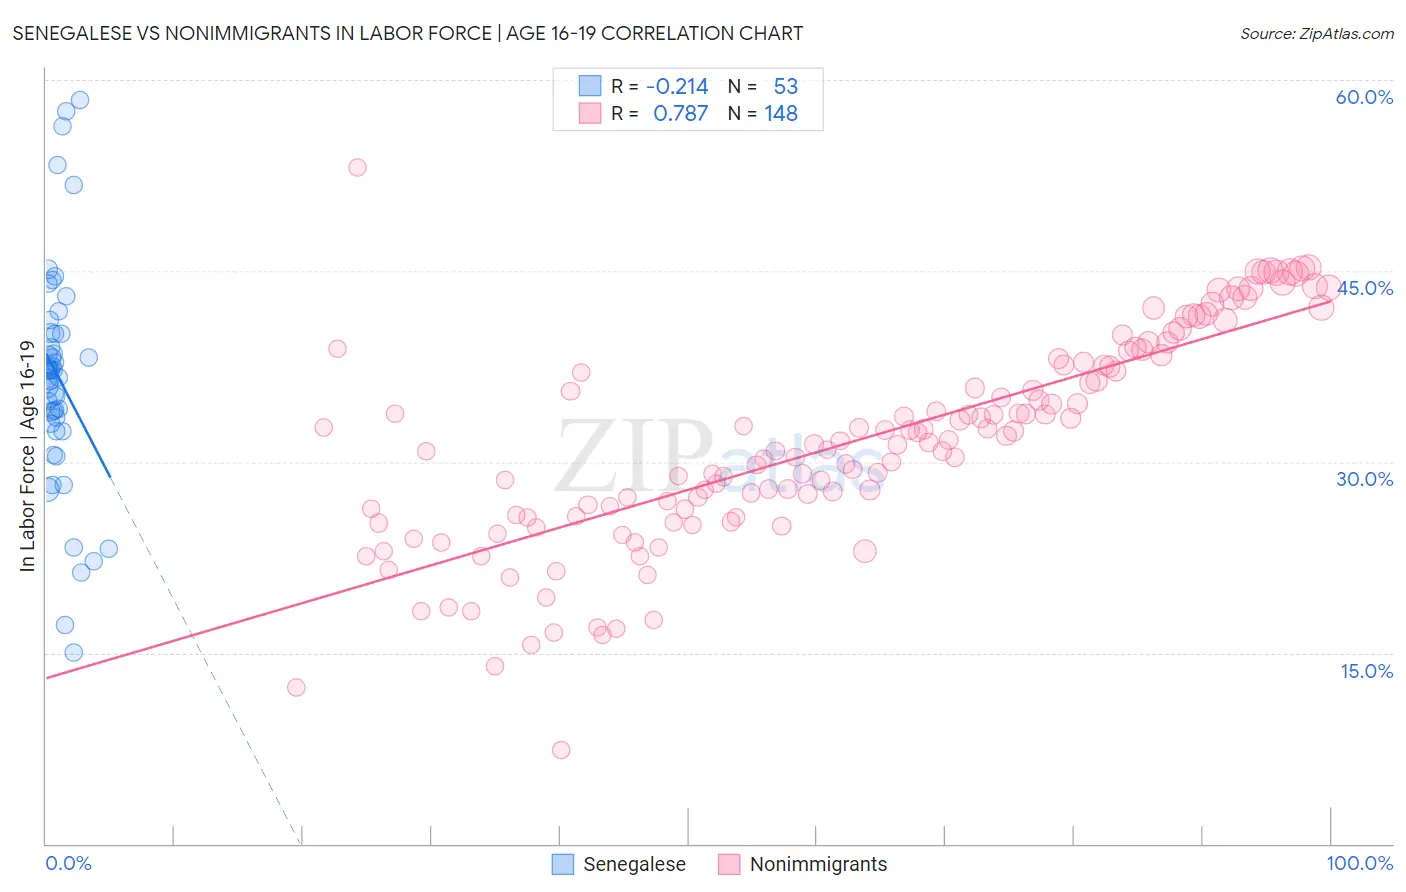
Senegalese vs Nonimmigrants In Labor Force | Age 16-19 Correlation Chart
The statistical analysis conducted on geographies consisting of 78,118,537 people shows a weak negative correlation between the proportion of Senegalese and labor force participation rate among population between the ages 16 and 19 in the United States with a correlation coefficient (R) of -0.214 and weighted average of 35.9%. Similarly, the statistical analysis conducted on geographies consisting of 578,466,762 people shows a strong positive correlation between the proportion of Nonimmigrants and labor force participation rate among population between the ages 16 and 19 in the United States with a correlation coefficient (R) of 0.787 and weighted average of 40.1%, a difference of 11.8%.
In Labor Force | Age 16-19 Correlation Summary
| Measurement | Senegalese | Nonimmigrants |
| Minimum | 15.0% | 7.3% |
| Maximum | 58.4% | 53.1% |
| Range | 43.4% | 45.8% |
| Mean | 36.6% | 31.6% |
| Median | 37.2% | 31.6% |
| Interquartile 25% (IQ1) | 32.7% | 25.8% |
| Interquartile 75% (IQ3) | 40.1% | 37.7% |
| Interquartile Range (IQR) | 7.4% | 12.0% |
| Standard Deviation (Sample) | 9.0% | 8.3% |
| Standard Deviation (Population) | 8.9% | 8.3% |
Similar Demographics by In Labor Force | Age 16-19
Demographics Similar to Senegalese by In Labor Force | Age 16-19
In terms of in labor force | age 16-19, the demographic groups most similar to Senegalese are Alsatian (35.9%, a difference of 0.010%), Immigrants from Nigeria (35.8%, a difference of 0.060%), Immigrants from Sweden (35.9%, a difference of 0.12%), Immigrants from Norway (35.9%, a difference of 0.20%), and Immigrants from Northern Africa (35.9%, a difference of 0.21%).
| Demographics | Rating | Rank | In Labor Force | Age 16-19 |
| Bolivians | 23.3 /100 | #195 | Fair 36.0% |
| Mexican American Indians | 21.1 /100 | #196 | Fair 36.0% |
| Immigrants | Serbia | 21.0 /100 | #197 | Fair 36.0% |
| Immigrants | Northern Africa | 19.9 /100 | #198 | Poor 35.9% |
| Immigrants | Norway | 19.8 /100 | #199 | Poor 35.9% |
| Immigrants | Sweden | 18.8 /100 | #200 | Poor 35.9% |
| Alsatians | 17.5 /100 | #201 | Poor 35.9% |
| Senegalese | 17.4 /100 | #202 | Poor 35.9% |
| Immigrants | Nigeria | 16.8 /100 | #203 | Poor 35.8% |
| Immigrants | Albania | 15.0 /100 | #204 | Poor 35.8% |
| South American Indians | 14.6 /100 | #205 | Poor 35.8% |
| Chileans | 14.6 /100 | #206 | Poor 35.8% |
| Immigrants | Eastern Europe | 14.5 /100 | #207 | Poor 35.8% |
| Koreans | 13.3 /100 | #208 | Poor 35.7% |
| Moroccans | 12.7 /100 | #209 | Poor 35.7% |
Demographics Similar to Nonimmigrants by In Labor Force | Age 16-19
In terms of in labor force | age 16-19, the demographic groups most similar to Nonimmigrants are Canadian (40.1%, a difference of 0.010%), Italian (40.1%, a difference of 0.070%), Kenyan (40.1%, a difference of 0.12%), Potawatomi (40.0%, a difference of 0.14%), and Portuguese (40.0%, a difference of 0.19%).
| Demographics | Rating | Rank | In Labor Force | Age 16-19 |
| Slavs | 100.0 /100 | #59 | Exceptional 40.4% |
| Immigrants | Eastern Africa | 100.0 /100 | #60 | Exceptional 40.4% |
| Americans | 100.0 /100 | #61 | Exceptional 40.3% |
| Cherokee | 100.0 /100 | #62 | Exceptional 40.2% |
| Northern Europeans | 100.0 /100 | #63 | Exceptional 40.2% |
| Immigrants | Micronesia | 100.0 /100 | #64 | Exceptional 40.2% |
| Kenyans | 100.0 /100 | #65 | Exceptional 40.1% |
| Immigrants | Nonimmigrants | 100.0 /100 | #66 | Exceptional 40.1% |
| Canadians | 100.0 /100 | #67 | Exceptional 40.1% |
| Italians | 99.9 /100 | #68 | Exceptional 40.1% |
| Potawatomi | 99.9 /100 | #69 | Exceptional 40.0% |
| Portuguese | 99.9 /100 | #70 | Exceptional 40.0% |
| Serbians | 99.9 /100 | #71 | Exceptional 39.9% |
| Iroquois | 99.9 /100 | #72 | Exceptional 39.9% |
| Immigrants | Middle Africa | 99.9 /100 | #73 | Exceptional 39.9% |