Immigrants from Burma/Myanmar vs Nonimmigrants Single Mother Households
COMPARE
Immigrants from Burma/Myanmar
Nonimmigrants
Single Mother Households
Single Mother Households Comparison
Immigrants from Burma/Myanmar
Nonimmigrants
7.0%
SINGLE MOTHER HOUSEHOLDS
1.4/ 100
METRIC RATING
235th/ 347
METRIC RANK
6.7%
SINGLE MOTHER HOUSEHOLDS
10.4/ 100
METRIC RATING
210th/ 347
METRIC RANK
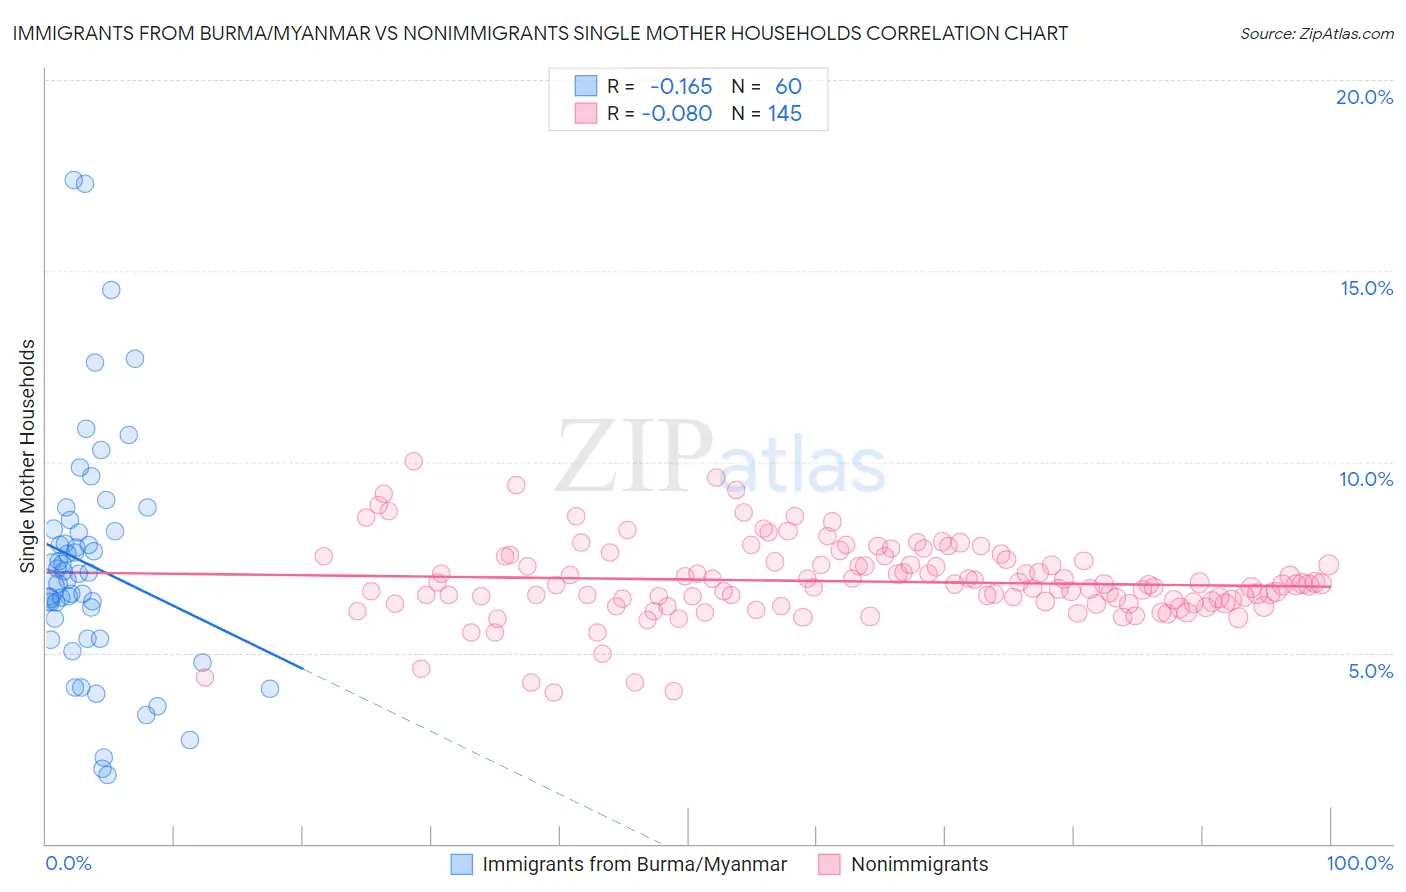
Immigrants from Burma/Myanmar vs Nonimmigrants Single Mother Households Correlation Chart
The statistical analysis conducted on geographies consisting of 172,110,214 people shows a poor negative correlation between the proportion of Immigrants from Burma/Myanmar and percentage of single mother households in the United States with a correlation coefficient (R) of -0.165 and weighted average of 7.0%. Similarly, the statistical analysis conducted on geographies consisting of 577,079,172 people shows a slight negative correlation between the proportion of Nonimmigrants and percentage of single mother households in the United States with a correlation coefficient (R) of -0.080 and weighted average of 6.7%, a difference of 5.5%.
Single Mother Households Correlation Summary
| Measurement | Immigrants from Burma/Myanmar | Nonimmigrants |
| Minimum | 1.8% | 4.0% |
| Maximum | 17.4% | 10.0% |
| Range | 15.6% | 6.1% |
| Mean | 7.3% | 6.9% |
| Median | 7.1% | 6.8% |
| Interquartile 25% (IQ1) | 5.6% | 6.3% |
| Interquartile 75% (IQ3) | 8.2% | 7.4% |
| Interquartile Range (IQR) | 2.6% | 1.1% |
| Standard Deviation (Sample) | 3.1% | 1.0% |
| Standard Deviation (Population) | 3.1% | 1.0% |
Similar Demographics by Single Mother Households
Demographics Similar to Immigrants from Burma/Myanmar by Single Mother Households
In terms of single mother households, the demographic groups most similar to Immigrants from Burma/Myanmar are Chickasaw (7.0%, a difference of 0.070%), Choctaw (7.0%, a difference of 0.090%), Comanche (7.0%, a difference of 0.26%), Spanish American (7.0%, a difference of 0.32%), and Creek (7.0%, a difference of 0.34%).
| Demographics | Rating | Rank | Single Mother Households |
| Iroquois | 2.2 /100 | #228 | Tragic 7.0% |
| Immigrants | Kenya | 2.1 /100 | #229 | Tragic 7.0% |
| Creek | 1.6 /100 | #230 | Tragic 7.0% |
| Spanish Americans | 1.6 /100 | #231 | Tragic 7.0% |
| Comanche | 1.5 /100 | #232 | Tragic 7.0% |
| Choctaw | 1.4 /100 | #233 | Tragic 7.0% |
| Chickasaw | 1.4 /100 | #234 | Tragic 7.0% |
| Immigrants | Burma/Myanmar | 1.4 /100 | #235 | Tragic 7.0% |
| Ute | 1.0 /100 | #236 | Tragic 7.1% |
| Arapaho | 1.0 /100 | #237 | Tragic 7.1% |
| Panamanians | 0.9 /100 | #238 | Tragic 7.1% |
| Kiowa | 0.8 /100 | #239 | Tragic 7.1% |
| Immigrants | Panama | 0.7 /100 | #240 | Tragic 7.2% |
| Immigrants | Portugal | 0.6 /100 | #241 | Tragic 7.2% |
| Fijians | 0.6 /100 | #242 | Tragic 7.2% |
Demographics Similar to Nonimmigrants by Single Mother Households
In terms of single mother households, the demographic groups most similar to Nonimmigrants are Immigrants from Colombia (6.7%, a difference of 0.020%), Vietnamese (6.7%, a difference of 0.23%), German Russian (6.7%, a difference of 0.29%), Immigrants from South America (6.7%, a difference of 0.29%), and Cree (6.7%, a difference of 0.37%).
| Demographics | Rating | Rank | Single Mother Households |
| Immigrants | Peru | 12.0 /100 | #203 | Poor 6.7% |
| Immigrants | Fiji | 11.9 /100 | #204 | Poor 6.7% |
| Cree | 11.9 /100 | #205 | Poor 6.7% |
| German Russians | 11.5 /100 | #206 | Poor 6.7% |
| Immigrants | South America | 11.5 /100 | #207 | Poor 6.7% |
| Vietnamese | 11.3 /100 | #208 | Poor 6.7% |
| Immigrants | Colombia | 10.5 /100 | #209 | Poor 6.7% |
| Immigrants | Nonimmigrants | 10.4 /100 | #210 | Poor 6.7% |
| Immigrants | Venezuela | 8.5 /100 | #211 | Tragic 6.7% |
| Immigrants | Eritrea | 8.4 /100 | #212 | Tragic 6.7% |
| Immigrants | Costa Rica | 8.2 /100 | #213 | Tragic 6.7% |
| Immigrants | Uruguay | 7.9 /100 | #214 | Tragic 6.7% |
| Shoshone | 5.7 /100 | #215 | Tragic 6.8% |
| Cherokee | 5.1 /100 | #216 | Tragic 6.8% |
| Aleuts | 4.8 /100 | #217 | Tragic 6.8% |