Seminole vs Spanish American Indian Family Households
COMPARE
Seminole
Spanish American Indian
Family Households
Family Households Comparison
Seminole
Spanish American Indians
64.0%
FAMILY HOUSEHOLDS
18.9/ 100
METRIC RATING
197th/ 347
METRIC RANK
71.2%
FAMILY HOUSEHOLDS
100.0/ 100
METRIC RATING
2nd/ 347
METRIC RANK
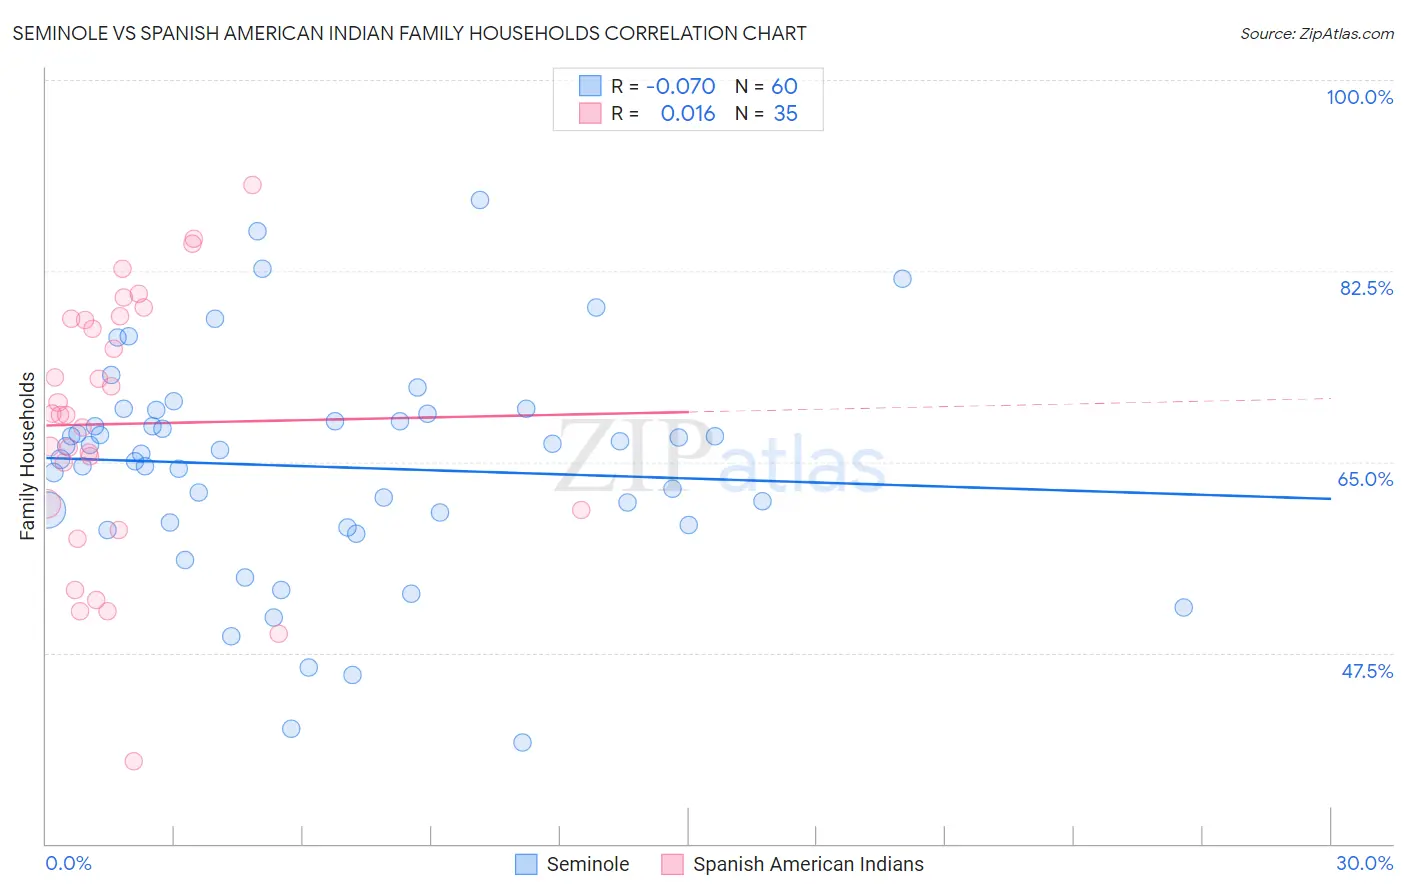
Seminole vs Spanish American Indian Family Households Correlation Chart
The statistical analysis conducted on geographies consisting of 118,298,678 people shows a slight negative correlation between the proportion of Seminole and percentage of family households in the United States with a correlation coefficient (R) of -0.070 and weighted average of 64.0%. Similarly, the statistical analysis conducted on geographies consisting of 73,145,550 people shows no correlation between the proportion of Spanish American Indians and percentage of family households in the United States with a correlation coefficient (R) of 0.016 and weighted average of 71.2%, a difference of 11.2%.
Family Households Correlation Summary
| Measurement | Seminole | Spanish American Indian |
| Minimum | 39.3% | 37.6% |
| Maximum | 89.0% | 90.4% |
| Range | 49.7% | 52.8% |
| Mean | 64.6% | 68.5% |
| Median | 65.9% | 69.3% |
| Interquartile 25% (IQ1) | 59.4% | 60.6% |
| Interquartile 75% (IQ3) | 69.1% | 78.1% |
| Interquartile Range (IQR) | 9.7% | 17.5% |
| Standard Deviation (Sample) | 10.1% | 11.9% |
| Standard Deviation (Population) | 10.0% | 11.8% |
Similar Demographics by Family Households
Demographics Similar to Seminole by Family Households
In terms of family households, the demographic groups most similar to Seminole are Polish (64.0%, a difference of 0.0%), Immigrants from Canada (64.0%, a difference of 0.010%), Slavic (64.0%, a difference of 0.010%), Immigrants from North America (64.0%, a difference of 0.020%), and Immigrants from Malaysia (64.0%, a difference of 0.020%).
| Demographics | Rating | Rank | Family Households |
| Zimbabweans | 24.7 /100 | #190 | Fair 64.1% |
| Arabs | 24.5 /100 | #191 | Fair 64.1% |
| Lithuanians | 23.8 /100 | #192 | Fair 64.0% |
| French | 23.7 /100 | #193 | Fair 64.0% |
| Paiute | 22.2 /100 | #194 | Fair 64.0% |
| Immigrants | North America | 20.0 /100 | #195 | Poor 64.0% |
| Immigrants | Canada | 19.2 /100 | #196 | Poor 64.0% |
| Seminole | 18.9 /100 | #197 | Poor 64.0% |
| Poles | 18.9 /100 | #198 | Poor 64.0% |
| Slavs | 18.6 /100 | #199 | Poor 64.0% |
| Immigrants | Malaysia | 17.9 /100 | #200 | Poor 64.0% |
| Immigrants | Eastern Europe | 17.2 /100 | #201 | Poor 64.0% |
| Iranians | 13.5 /100 | #202 | Poor 63.9% |
| Norwegians | 13.2 /100 | #203 | Poor 63.9% |
| Immigrants | Uruguay | 12.8 /100 | #204 | Poor 63.9% |
Demographics Similar to Spanish American Indians by Family Households
In terms of family households, the demographic groups most similar to Spanish American Indians are Yup'ik (72.4%, a difference of 1.8%), Tongan (69.6%, a difference of 2.2%), Yakama (69.3%, a difference of 2.7%), Yuman (69.3%, a difference of 2.7%), and Immigrants from Mexico (69.1%, a difference of 2.9%).
| Demographics | Rating | Rank | Family Households |
| Yup'ik | 100 /100 | #1 | Exceptional 72.4% |
| Spanish American Indians | 100.0 /100 | #2 | Exceptional 71.2% |
| Tongans | 100.0 /100 | #3 | Exceptional 69.6% |
| Yakama | 100.0 /100 | #4 | Exceptional 69.3% |
| Yuman | 100.0 /100 | #5 | Exceptional 69.3% |
| Immigrants | Mexico | 100.0 /100 | #6 | Exceptional 69.1% |
| Mexicans | 100.0 /100 | #7 | Exceptional 69.0% |
| Immigrants | Fiji | 100.0 /100 | #8 | Exceptional 68.8% |
| Native Hawaiians | 100.0 /100 | #9 | Exceptional 68.4% |
| Immigrants | Philippines | 100.0 /100 | #10 | Exceptional 68.3% |
| Immigrants | Central America | 100.0 /100 | #11 | Exceptional 68.3% |
| Koreans | 100.0 /100 | #12 | Exceptional 68.3% |
| Pueblo | 100.0 /100 | #13 | Exceptional 68.2% |
| Immigrants | Cuba | 100.0 /100 | #14 | Exceptional 68.2% |
| Assyrians/Chaldeans/Syriacs | 100.0 /100 | #15 | Exceptional 68.2% |