Scottish vs Immigrants from Bahamas Family Households
COMPARE
Scottish
Immigrants from Bahamas
Family Households
Family Households Comparison
Scottish
Immigrants from Bahamas
64.5%
FAMILY HOUSEHOLDS
70.9/ 100
METRIC RATING
152nd/ 347
METRIC RANK
63.6%
FAMILY HOUSEHOLDS
4.2/ 100
METRIC RATING
226th/ 347
METRIC RANK
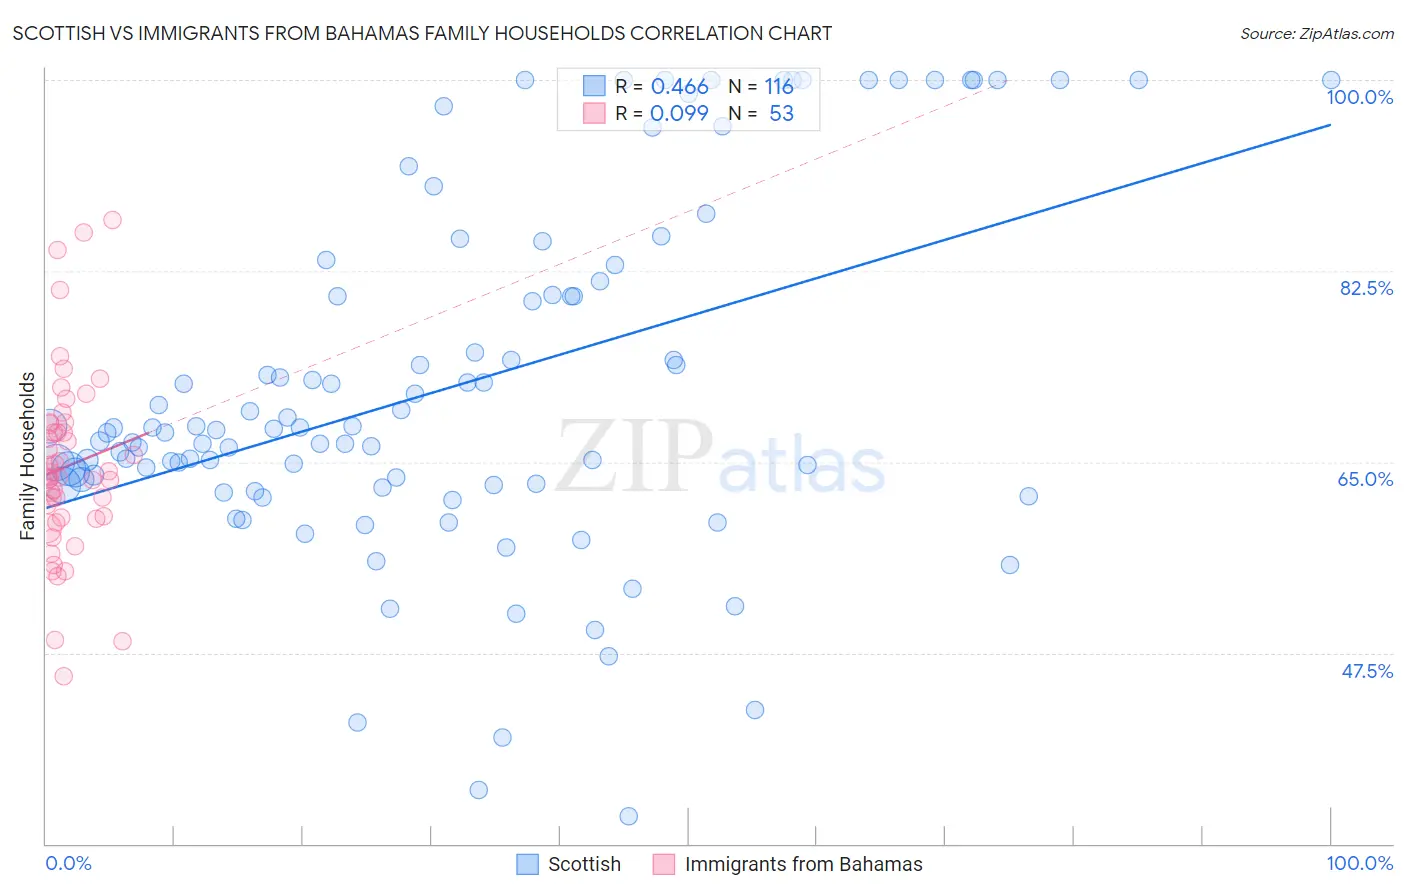
Scottish vs Immigrants from Bahamas Family Households Correlation Chart
The statistical analysis conducted on geographies consisting of 566,567,551 people shows a moderate positive correlation between the proportion of Scottish and percentage of family households in the United States with a correlation coefficient (R) of 0.466 and weighted average of 64.5%. Similarly, the statistical analysis conducted on geographies consisting of 104,610,461 people shows a slight positive correlation between the proportion of Immigrants from Bahamas and percentage of family households in the United States with a correlation coefficient (R) of 0.099 and weighted average of 63.6%, a difference of 1.4%.
Family Households Correlation Summary
| Measurement | Scottish | Immigrants from Bahamas |
| Minimum | 32.6% | 45.4% |
| Maximum | 100.0% | 87.2% |
| Range | 67.4% | 41.8% |
| Mean | 71.9% | 64.6% |
| Median | 67.9% | 63.6% |
| Interquartile 25% (IQ1) | 63.0% | 59.9% |
| Interquartile 75% (IQ3) | 80.9% | 68.5% |
| Interquartile Range (IQR) | 18.0% | 8.7% |
| Standard Deviation (Sample) | 16.1% | 8.4% |
| Standard Deviation (Population) | 16.1% | 8.4% |
Similar Demographics by Family Households
Demographics Similar to Scottish by Family Households
In terms of family households, the demographic groups most similar to Scottish are Swedish (64.5%, a difference of 0.020%), Austrian (64.5%, a difference of 0.040%), Uruguayan (64.5%, a difference of 0.050%), Czech (64.5%, a difference of 0.060%), and Romanian (64.5%, a difference of 0.070%).
| Demographics | Rating | Rank | Family Households |
| Welsh | 80.1 /100 | #145 | Excellent 64.6% |
| Immigrants | Romania | 77.0 /100 | #146 | Good 64.6% |
| Immigrants | Chile | 76.5 /100 | #147 | Good 64.6% |
| Delaware | 76.3 /100 | #148 | Good 64.6% |
| Sioux | 76.3 /100 | #149 | Good 64.6% |
| Romanians | 75.3 /100 | #150 | Good 64.5% |
| Syrians | 75.2 /100 | #151 | Good 64.5% |
| Scottish | 70.9 /100 | #152 | Good 64.5% |
| Swedes | 69.8 /100 | #153 | Good 64.5% |
| Austrians | 68.5 /100 | #154 | Good 64.5% |
| Uruguayans | 67.7 /100 | #155 | Good 64.5% |
| Czechs | 67.0 /100 | #156 | Good 64.5% |
| Canadians | 66.6 /100 | #157 | Good 64.4% |
| Lebanese | 66.4 /100 | #158 | Good 64.4% |
| Germans | 65.8 /100 | #159 | Good 64.4% |
Demographics Similar to Immigrants from Bahamas by Family Households
In terms of family households, the demographic groups most similar to Immigrants from Bahamas are Immigrants from Hungary (63.6%, a difference of 0.010%), Trinidadian and Tobagonian (63.6%, a difference of 0.010%), Turkish (63.6%, a difference of 0.020%), Blackfeet (63.6%, a difference of 0.060%), and Bulgarian (63.6%, a difference of 0.070%).
| Demographics | Rating | Rank | Family Households |
| Macedonians | 6.5 /100 | #219 | Tragic 63.7% |
| Immigrants | Europe | 6.4 /100 | #220 | Tragic 63.7% |
| Immigrants | South Africa | 5.9 /100 | #221 | Tragic 63.7% |
| Immigrants | Belarus | 5.5 /100 | #222 | Tragic 63.7% |
| French Canadians | 5.4 /100 | #223 | Tragic 63.7% |
| Turks | 4.5 /100 | #224 | Tragic 63.6% |
| Immigrants | Hungary | 4.3 /100 | #225 | Tragic 63.6% |
| Immigrants | Bahamas | 4.2 /100 | #226 | Tragic 63.6% |
| Trinidadians and Tobagonians | 4.1 /100 | #227 | Tragic 63.6% |
| Blackfeet | 3.6 /100 | #228 | Tragic 63.6% |
| Bulgarians | 3.4 /100 | #229 | Tragic 63.6% |
| Immigrants | Brazil | 3.0 /100 | #230 | Tragic 63.6% |
| Immigrants | Greece | 2.9 /100 | #231 | Tragic 63.5% |
| Immigrants | Northern Africa | 2.6 /100 | #232 | Tragic 63.5% |
| Immigrants | Armenia | 2.6 /100 | #233 | Tragic 63.5% |