Irish vs Immigrants from Asia Currently Married
COMPARE
Irish
Immigrants from Asia
Currently Married
Currently Married Comparison
Irish
Immigrants from Asia
48.9%
CURRENTLY MARRIED
99.5/ 100
METRIC RATING
33rd/ 347
METRIC RANK
48.3%
CURRENTLY MARRIED
97.9/ 100
METRIC RATING
70th/ 347
METRIC RANK
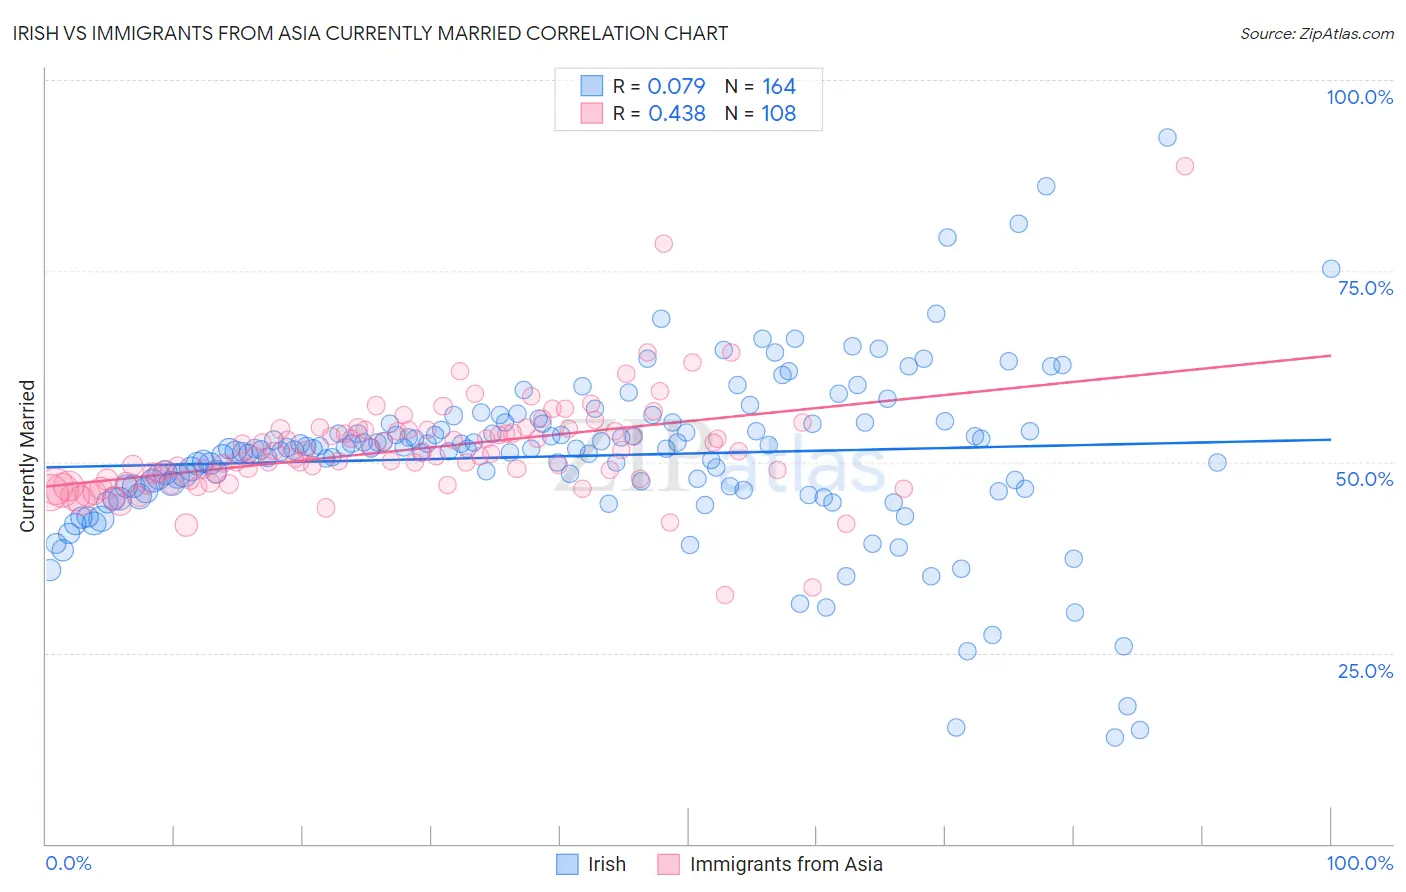
Irish vs Immigrants from Asia Currently Married Correlation Chart
The statistical analysis conducted on geographies consisting of 580,554,006 people shows a slight positive correlation between the proportion of Irish and percentage of population currently married in the United States with a correlation coefficient (R) of 0.079 and weighted average of 48.9%. Similarly, the statistical analysis conducted on geographies consisting of 549,041,877 people shows a moderate positive correlation between the proportion of Immigrants from Asia and percentage of population currently married in the United States with a correlation coefficient (R) of 0.438 and weighted average of 48.3%, a difference of 1.2%.
Currently Married Correlation Summary
| Measurement | Irish | Immigrants from Asia |
| Minimum | 13.9% | 32.6% |
| Maximum | 92.5% | 88.7% |
| Range | 78.6% | 56.1% |
| Mean | 50.8% | 51.6% |
| Median | 51.7% | 50.8% |
| Interquartile 25% (IQ1) | 46.6% | 47.5% |
| Interquartile 75% (IQ3) | 55.0% | 54.2% |
| Interquartile Range (IQR) | 8.4% | 6.7% |
| Standard Deviation (Sample) | 11.2% | 6.9% |
| Standard Deviation (Population) | 11.1% | 6.9% |
Similar Demographics by Currently Married
Demographics Similar to Irish by Currently Married
In terms of currently married, the demographic groups most similar to Irish are Immigrants from Hong Kong (48.9%, a difference of 0.040%), Eastern European (48.9%, a difference of 0.050%), Polish (48.9%, a difference of 0.050%), Croatian (48.9%, a difference of 0.060%), and Immigrants from Lithuania (48.8%, a difference of 0.060%).
| Demographics | Rating | Rank | Currently Married |
| Immigrants | Korea | 99.6 /100 | #26 | Exceptional 49.0% |
| Burmese | 99.6 /100 | #27 | Exceptional 48.9% |
| Welsh | 99.5 /100 | #28 | Exceptional 48.9% |
| Croatians | 99.5 /100 | #29 | Exceptional 48.9% |
| Eastern Europeans | 99.5 /100 | #30 | Exceptional 48.9% |
| Poles | 99.5 /100 | #31 | Exceptional 48.9% |
| Immigrants | Hong Kong | 99.5 /100 | #32 | Exceptional 48.9% |
| Irish | 99.5 /100 | #33 | Exceptional 48.9% |
| Immigrants | Lithuania | 99.4 /100 | #34 | Exceptional 48.8% |
| Immigrants | Northern Europe | 99.4 /100 | #35 | Exceptional 48.8% |
| Italians | 99.4 /100 | #36 | Exceptional 48.8% |
| Hungarians | 99.4 /100 | #37 | Exceptional 48.8% |
| Czechoslovakians | 99.4 /100 | #38 | Exceptional 48.8% |
| British | 99.4 /100 | #39 | Exceptional 48.8% |
| Immigrants | Canada | 99.4 /100 | #40 | Exceptional 48.8% |
Demographics Similar to Immigrants from Asia by Currently Married
In terms of currently married, the demographic groups most similar to Immigrants from Asia are Macedonian (48.3%, a difference of 0.010%), Canadian (48.3%, a difference of 0.090%), Immigrants from England (48.3%, a difference of 0.10%), Slovak (48.3%, a difference of 0.11%), and Tongan (48.3%, a difference of 0.12%).
| Demographics | Rating | Rank | Currently Married |
| Slavs | 98.3 /100 | #63 | Exceptional 48.4% |
| Immigrants | Czechoslovakia | 98.3 /100 | #64 | Exceptional 48.4% |
| Ukrainians | 98.3 /100 | #65 | Exceptional 48.4% |
| Tongans | 98.2 /100 | #66 | Exceptional 48.3% |
| Slovaks | 98.2 /100 | #67 | Exceptional 48.3% |
| Immigrants | England | 98.2 /100 | #68 | Exceptional 48.3% |
| Canadians | 98.1 /100 | #69 | Exceptional 48.3% |
| Immigrants | Asia | 97.9 /100 | #70 | Exceptional 48.3% |
| Macedonians | 97.9 /100 | #71 | Exceptional 48.3% |
| Immigrants | Lebanon | 97.6 /100 | #72 | Exceptional 48.2% |
| Immigrants | Eastern Asia | 97.5 /100 | #73 | Exceptional 48.2% |
| Estonians | 97.4 /100 | #74 | Exceptional 48.2% |
| Immigrants | Belarus | 97.2 /100 | #75 | Exceptional 48.1% |
| Basques | 97.2 /100 | #76 | Exceptional 48.1% |
| Slovenes | 97.1 /100 | #77 | Exceptional 48.1% |