Colville vs Immigrants from Senegal Family Households
COMPARE
Colville
Immigrants from Senegal
Family Households
Family Households Comparison
Colville
Immigrants from Senegal
63.2%
FAMILY HOUSEHOLDS
0.5/ 100
METRIC RATING
265th/ 347
METRIC RANK
60.1%
FAMILY HOUSEHOLDS
0.0/ 100
METRIC RATING
341st/ 347
METRIC RANK
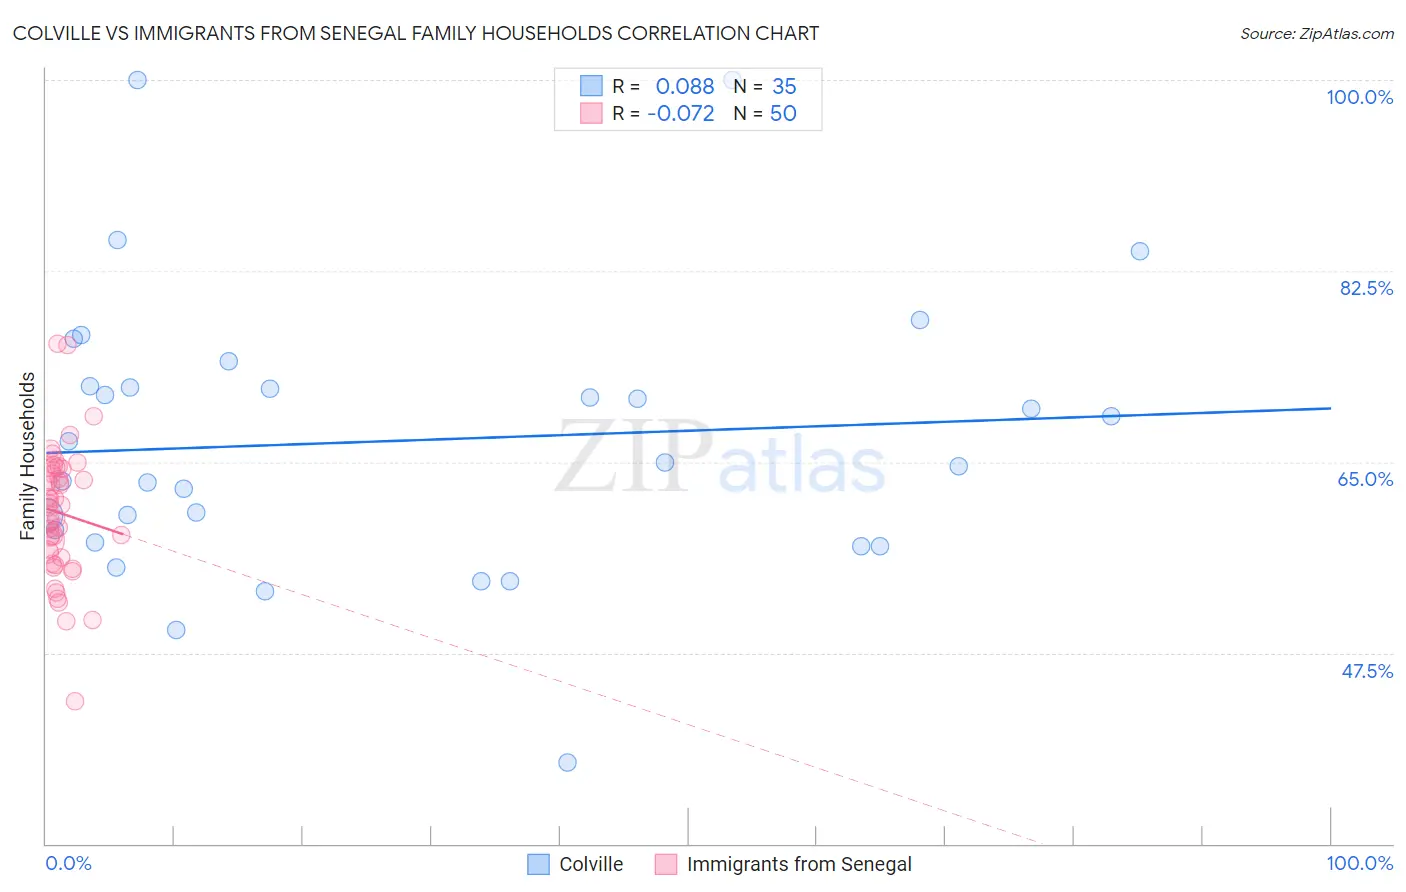
Colville vs Immigrants from Senegal Family Households Correlation Chart
The statistical analysis conducted on geographies consisting of 34,683,092 people shows a slight positive correlation between the proportion of Colville and percentage of family households in the United States with a correlation coefficient (R) of 0.088 and weighted average of 63.2%. Similarly, the statistical analysis conducted on geographies consisting of 90,120,671 people shows a slight negative correlation between the proportion of Immigrants from Senegal and percentage of family households in the United States with a correlation coefficient (R) of -0.072 and weighted average of 60.1%, a difference of 5.1%.
Family Households Correlation Summary
| Measurement | Colville | Immigrants from Senegal |
| Minimum | 37.5% | 43.0% |
| Maximum | 100.0% | 75.9% |
| Range | 62.5% | 32.9% |
| Mean | 66.9% | 60.3% |
| Median | 65.0% | 61.0% |
| Interquartile 25% (IQ1) | 57.6% | 56.2% |
| Interquartile 75% (IQ3) | 72.0% | 64.4% |
| Interquartile Range (IQR) | 14.4% | 8.2% |
| Standard Deviation (Sample) | 12.9% | 6.0% |
| Standard Deviation (Population) | 12.7% | 6.0% |
Similar Demographics by Family Households
Demographics Similar to Colville by Family Households
In terms of family households, the demographic groups most similar to Colville are Kenyan (63.2%, a difference of 0.010%), Immigrants from Western Africa (63.1%, a difference of 0.010%), Cheyenne (63.2%, a difference of 0.020%), Immigrants from Ireland (63.2%, a difference of 0.040%), and Immigrants from Russia (63.2%, a difference of 0.050%).
| Demographics | Rating | Rank | Family Households |
| Immigrants | Barbados | 0.7 /100 | #258 | Tragic 63.2% |
| Immigrants | Western Europe | 0.6 /100 | #259 | Tragic 63.2% |
| Cypriots | 0.6 /100 | #260 | Tragic 63.2% |
| Immigrants | Russia | 0.6 /100 | #261 | Tragic 63.2% |
| Immigrants | Ireland | 0.6 /100 | #262 | Tragic 63.2% |
| Cheyenne | 0.5 /100 | #263 | Tragic 63.2% |
| Kenyans | 0.5 /100 | #264 | Tragic 63.2% |
| Colville | 0.5 /100 | #265 | Tragic 63.2% |
| Immigrants | Western Africa | 0.5 /100 | #266 | Tragic 63.1% |
| Israelis | 0.4 /100 | #267 | Tragic 63.1% |
| Immigrants | Singapore | 0.4 /100 | #268 | Tragic 63.1% |
| Yugoslavians | 0.4 /100 | #269 | Tragic 63.1% |
| Immigrants | Austria | 0.3 /100 | #270 | Tragic 63.1% |
| Immigrants | Croatia | 0.3 /100 | #271 | Tragic 63.1% |
| Immigrants | Turkey | 0.3 /100 | #272 | Tragic 63.1% |
Demographics Similar to Immigrants from Senegal by Family Households
In terms of family households, the demographic groups most similar to Immigrants from Senegal are Immigrants from Sudan (60.2%, a difference of 0.080%), Sudanese (60.0%, a difference of 0.18%), Senegalese (59.8%, a difference of 0.48%), Immigrants from Saudi Arabia (60.7%, a difference of 0.98%), and Immigrants from Eritrea (60.8%, a difference of 1.2%).
| Demographics | Rating | Rank | Family Households |
| Immigrants | Ethiopia | 0.0 /100 | #333 | Tragic 61.2% |
| Immigrants | Eastern Africa | 0.0 /100 | #334 | Tragic 61.1% |
| Carpatho Rusyns | 0.0 /100 | #335 | Tragic 61.1% |
| German Russians | 0.0 /100 | #336 | Tragic 60.9% |
| Soviet Union | 0.0 /100 | #337 | Tragic 60.9% |
| Immigrants | Eritrea | 0.0 /100 | #338 | Tragic 60.8% |
| Immigrants | Saudi Arabia | 0.0 /100 | #339 | Tragic 60.7% |
| Immigrants | Sudan | 0.0 /100 | #340 | Tragic 60.2% |
| Immigrants | Senegal | 0.0 /100 | #341 | Tragic 60.1% |
| Sudanese | 0.0 /100 | #342 | Tragic 60.0% |
| Senegalese | 0.0 /100 | #343 | Tragic 59.8% |
| Immigrants | Congo | 0.0 /100 | #344 | Tragic 59.2% |
| Immigrants | Zaire | 0.0 /100 | #345 | Tragic 59.2% |
| Somalis | 0.0 /100 | #346 | Tragic 57.6% |
| Immigrants | Somalia | 0.0 /100 | #347 | Tragic 56.7% |