Immigrants from Germany vs Immigrants from Senegal Family Households
COMPARE
Immigrants from Germany
Immigrants from Senegal
Family Households
Family Households Comparison
Immigrants from Germany
Immigrants from Senegal
64.3%
FAMILY HOUSEHOLDS
50.0/ 100
METRIC RATING
174th/ 347
METRIC RANK
60.1%
FAMILY HOUSEHOLDS
0.0/ 100
METRIC RATING
341st/ 347
METRIC RANK
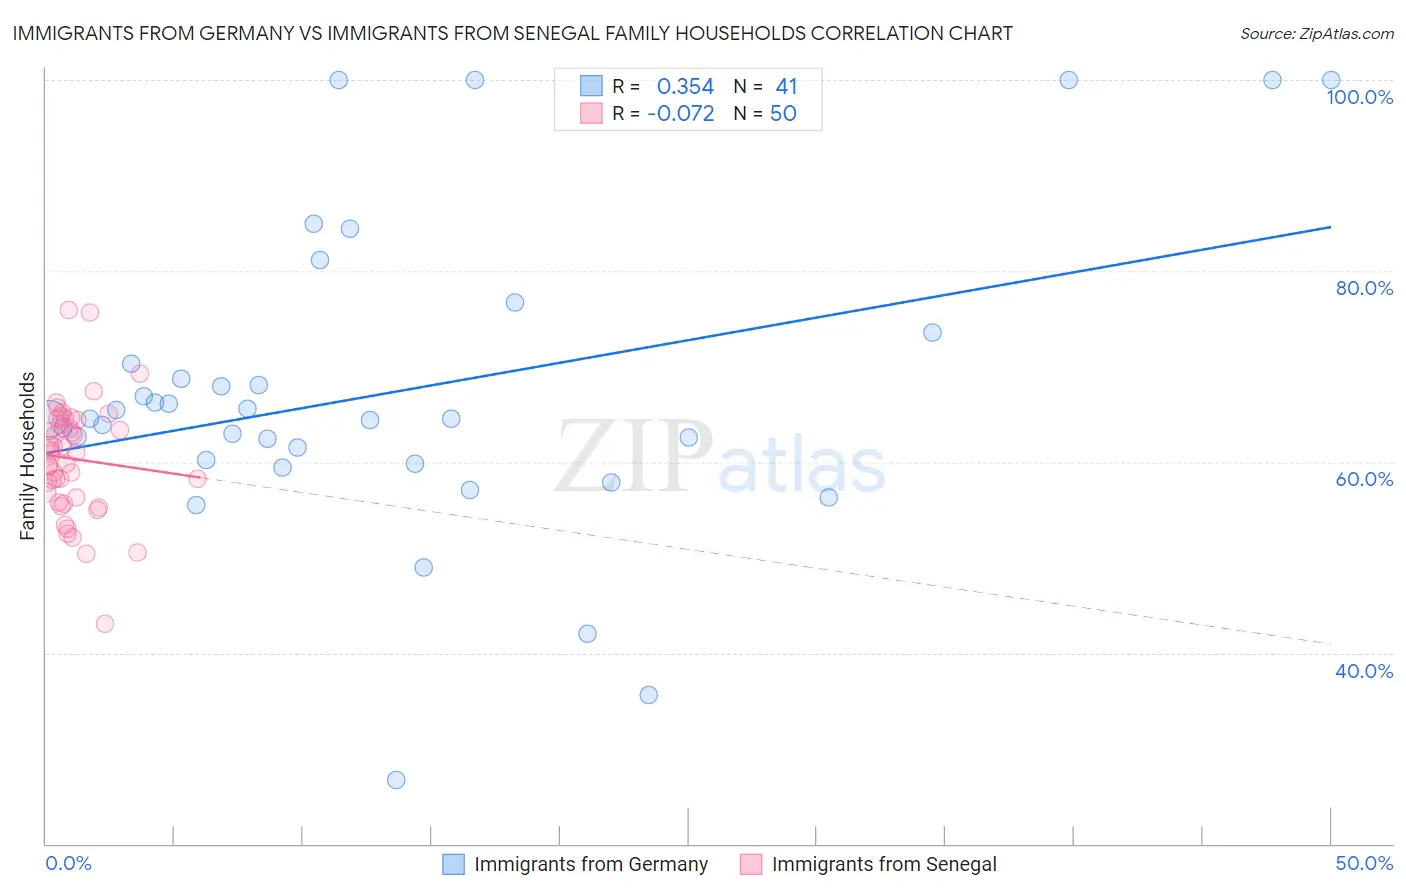
Immigrants from Germany vs Immigrants from Senegal Family Households Correlation Chart
The statistical analysis conducted on geographies consisting of 463,759,917 people shows a mild positive correlation between the proportion of Immigrants from Germany and percentage of family households in the United States with a correlation coefficient (R) of 0.354 and weighted average of 64.3%. Similarly, the statistical analysis conducted on geographies consisting of 90,120,671 people shows a slight negative correlation between the proportion of Immigrants from Senegal and percentage of family households in the United States with a correlation coefficient (R) of -0.072 and weighted average of 60.1%, a difference of 7.0%.
Family Households Correlation Summary
| Measurement | Immigrants from Germany | Immigrants from Senegal |
| Minimum | 26.7% | 43.0% |
| Maximum | 100.0% | 75.9% |
| Range | 73.3% | 32.9% |
| Mean | 67.4% | 60.3% |
| Median | 64.5% | 61.0% |
| Interquartile 25% (IQ1) | 60.0% | 56.2% |
| Interquartile 75% (IQ3) | 71.9% | 64.4% |
| Interquartile Range (IQR) | 11.9% | 8.2% |
| Standard Deviation (Sample) | 16.4% | 6.0% |
| Standard Deviation (Population) | 16.2% | 6.0% |
Similar Demographics by Family Households
Demographics Similar to Immigrants from Germany by Family Households
In terms of family households, the demographic groups most similar to Immigrants from Germany are Immigrants from Sierra Leone (64.3%, a difference of 0.030%), Dutch West Indian (64.3%, a difference of 0.050%), Ute (64.3%, a difference of 0.060%), Iraqi (64.4%, a difference of 0.080%), and Armenian (64.4%, a difference of 0.080%).
| Demographics | Rating | Rank | Family Households |
| Irish | 57.9 /100 | #167 | Average 64.4% |
| Hondurans | 57.5 /100 | #168 | Average 64.4% |
| Iraqis | 56.0 /100 | #169 | Average 64.4% |
| Armenians | 55.9 /100 | #170 | Average 64.4% |
| Ute | 54.6 /100 | #171 | Average 64.3% |
| Dutch West Indians | 53.9 /100 | #172 | Average 64.3% |
| Immigrants | Sierra Leone | 52.5 /100 | #173 | Average 64.3% |
| Immigrants | Germany | 50.0 /100 | #174 | Average 64.3% |
| Bangladeshis | 44.3 /100 | #175 | Average 64.3% |
| Vietnamese | 43.6 /100 | #176 | Average 64.2% |
| Immigrants | Micronesia | 42.3 /100 | #177 | Average 64.2% |
| Jamaicans | 40.6 /100 | #178 | Average 64.2% |
| Immigrants | Ukraine | 38.2 /100 | #179 | Fair 64.2% |
| Immigrants | Honduras | 35.0 /100 | #180 | Fair 64.2% |
| Immigrants | Trinidad and Tobago | 34.9 /100 | #181 | Fair 64.2% |
Demographics Similar to Immigrants from Senegal by Family Households
In terms of family households, the demographic groups most similar to Immigrants from Senegal are Immigrants from Sudan (60.2%, a difference of 0.080%), Sudanese (60.0%, a difference of 0.18%), Senegalese (59.8%, a difference of 0.48%), Immigrants from Saudi Arabia (60.7%, a difference of 0.98%), and Immigrants from Eritrea (60.8%, a difference of 1.2%).
| Demographics | Rating | Rank | Family Households |
| Immigrants | Ethiopia | 0.0 /100 | #333 | Tragic 61.2% |
| Immigrants | Eastern Africa | 0.0 /100 | #334 | Tragic 61.1% |
| Carpatho Rusyns | 0.0 /100 | #335 | Tragic 61.1% |
| German Russians | 0.0 /100 | #336 | Tragic 60.9% |
| Soviet Union | 0.0 /100 | #337 | Tragic 60.9% |
| Immigrants | Eritrea | 0.0 /100 | #338 | Tragic 60.8% |
| Immigrants | Saudi Arabia | 0.0 /100 | #339 | Tragic 60.7% |
| Immigrants | Sudan | 0.0 /100 | #340 | Tragic 60.2% |
| Immigrants | Senegal | 0.0 /100 | #341 | Tragic 60.1% |
| Sudanese | 0.0 /100 | #342 | Tragic 60.0% |
| Senegalese | 0.0 /100 | #343 | Tragic 59.8% |
| Immigrants | Congo | 0.0 /100 | #344 | Tragic 59.2% |
| Immigrants | Zaire | 0.0 /100 | #345 | Tragic 59.2% |
| Somalis | 0.0 /100 | #346 | Tragic 57.6% |
| Immigrants | Somalia | 0.0 /100 | #347 | Tragic 56.7% |