Palestinian vs Immigrants from Liberia Currently Married
COMPARE
Palestinian
Immigrants from Liberia
Currently Married
Currently Married Comparison
Palestinians
Immigrants from Liberia
47.6%
CURRENTLY MARRIED
90.4/ 100
METRIC RATING
116th/ 347
METRIC RANK
41.8%
CURRENTLY MARRIED
0.0/ 100
METRIC RATING
309th/ 347
METRIC RANK
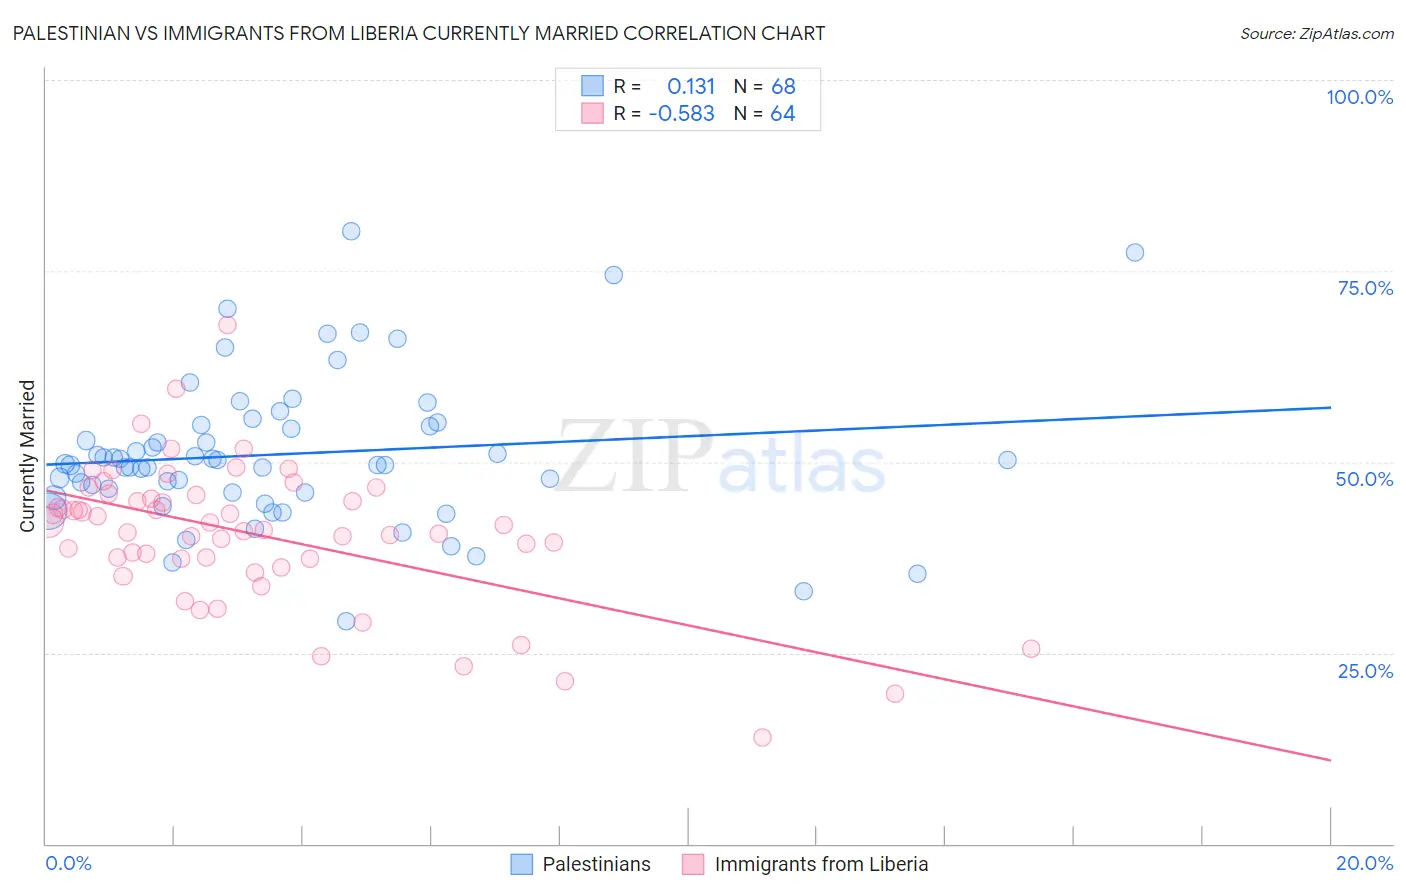
Palestinian vs Immigrants from Liberia Currently Married Correlation Chart
The statistical analysis conducted on geographies consisting of 216,437,079 people shows a poor positive correlation between the proportion of Palestinians and percentage of population currently married in the United States with a correlation coefficient (R) of 0.131 and weighted average of 47.6%. Similarly, the statistical analysis conducted on geographies consisting of 135,288,317 people shows a substantial negative correlation between the proportion of Immigrants from Liberia and percentage of population currently married in the United States with a correlation coefficient (R) of -0.583 and weighted average of 41.8%, a difference of 14.0%.
Currently Married Correlation Summary
| Measurement | Palestinian | Immigrants from Liberia |
| Minimum | 29.1% | 13.9% |
| Maximum | 80.2% | 68.0% |
| Range | 51.1% | 54.1% |
| Mean | 51.0% | 40.5% |
| Median | 49.7% | 41.4% |
| Interquartile 25% (IQ1) | 46.0% | 37.3% |
| Interquartile 75% (IQ3) | 54.7% | 45.4% |
| Interquartile Range (IQR) | 8.7% | 8.2% |
| Standard Deviation (Sample) | 9.7% | 9.3% |
| Standard Deviation (Population) | 9.7% | 9.2% |
Similar Demographics by Currently Married
Demographics Similar to Palestinians by Currently Married
In terms of currently married, the demographic groups most similar to Palestinians are South African (47.6%, a difference of 0.010%), Immigrants from Indonesia (47.6%, a difference of 0.010%), Puget Sound Salish (47.6%, a difference of 0.020%), Immigrants from Philippines (47.6%, a difference of 0.020%), and Australian (47.6%, a difference of 0.020%).
| Demographics | Rating | Rank | Currently Married |
| Immigrants | Egypt | 92.3 /100 | #109 | Exceptional 47.7% |
| Immigrants | Russia | 92.0 /100 | #110 | Exceptional 47.7% |
| Immigrants | Hungary | 91.2 /100 | #111 | Exceptional 47.6% |
| Immigrants | Western Europe | 91.1 /100 | #112 | Exceptional 47.6% |
| Immigrants | Denmark | 90.9 /100 | #113 | Exceptional 47.6% |
| South Africans | 90.5 /100 | #114 | Exceptional 47.6% |
| Immigrants | Indonesia | 90.5 /100 | #115 | Exceptional 47.6% |
| Palestinians | 90.4 /100 | #116 | Exceptional 47.6% |
| Puget Sound Salish | 90.3 /100 | #117 | Exceptional 47.6% |
| Immigrants | Philippines | 90.2 /100 | #118 | Exceptional 47.6% |
| Australians | 90.2 /100 | #119 | Exceptional 47.6% |
| Syrians | 88.9 /100 | #120 | Excellent 47.5% |
| Immigrants | Croatia | 88.6 /100 | #121 | Excellent 47.5% |
| Osage | 87.9 /100 | #122 | Excellent 47.5% |
| Immigrants | Kazakhstan | 87.2 /100 | #123 | Excellent 47.4% |
Demographics Similar to Immigrants from Liberia by Currently Married
In terms of currently married, the demographic groups most similar to Immigrants from Liberia are Immigrants from Belize (41.8%, a difference of 0.11%), African (41.8%, a difference of 0.15%), Immigrants from Guyana (41.9%, a difference of 0.29%), Immigrants from Trinidad and Tobago (41.9%, a difference of 0.30%), and Immigrants from Bahamas (41.9%, a difference of 0.33%).
| Demographics | Rating | Rank | Currently Married |
| Immigrants | Zaire | 0.0 /100 | #302 | Tragic 42.0% |
| Sioux | 0.0 /100 | #303 | Tragic 41.9% |
| Immigrants | Bahamas | 0.0 /100 | #304 | Tragic 41.9% |
| Immigrants | Trinidad and Tobago | 0.0 /100 | #305 | Tragic 41.9% |
| Immigrants | Guyana | 0.0 /100 | #306 | Tragic 41.9% |
| Africans | 0.0 /100 | #307 | Tragic 41.8% |
| Immigrants | Belize | 0.0 /100 | #308 | Tragic 41.8% |
| Immigrants | Liberia | 0.0 /100 | #309 | Tragic 41.8% |
| Guyanese | 0.0 /100 | #310 | Tragic 41.6% |
| Trinidadians and Tobagonians | 0.0 /100 | #311 | Tragic 41.5% |
| Somalis | 0.0 /100 | #312 | Tragic 41.5% |
| Jamaicans | 0.0 /100 | #313 | Tragic 41.4% |
| West Indians | 0.0 /100 | #314 | Tragic 41.3% |
| Inupiat | 0.0 /100 | #315 | Tragic 41.3% |
| Immigrants | Caribbean | 0.0 /100 | #316 | Tragic 41.3% |