Immigrants from Scotland vs Immigrants from Liberia Currently Married
COMPARE
Immigrants from Scotland
Immigrants from Liberia
Currently Married
Currently Married Comparison
Immigrants from Scotland
Immigrants from Liberia
49.3%
CURRENTLY MARRIED
99.8/ 100
METRIC RATING
18th/ 347
METRIC RANK
41.8%
CURRENTLY MARRIED
0.0/ 100
METRIC RATING
309th/ 347
METRIC RANK
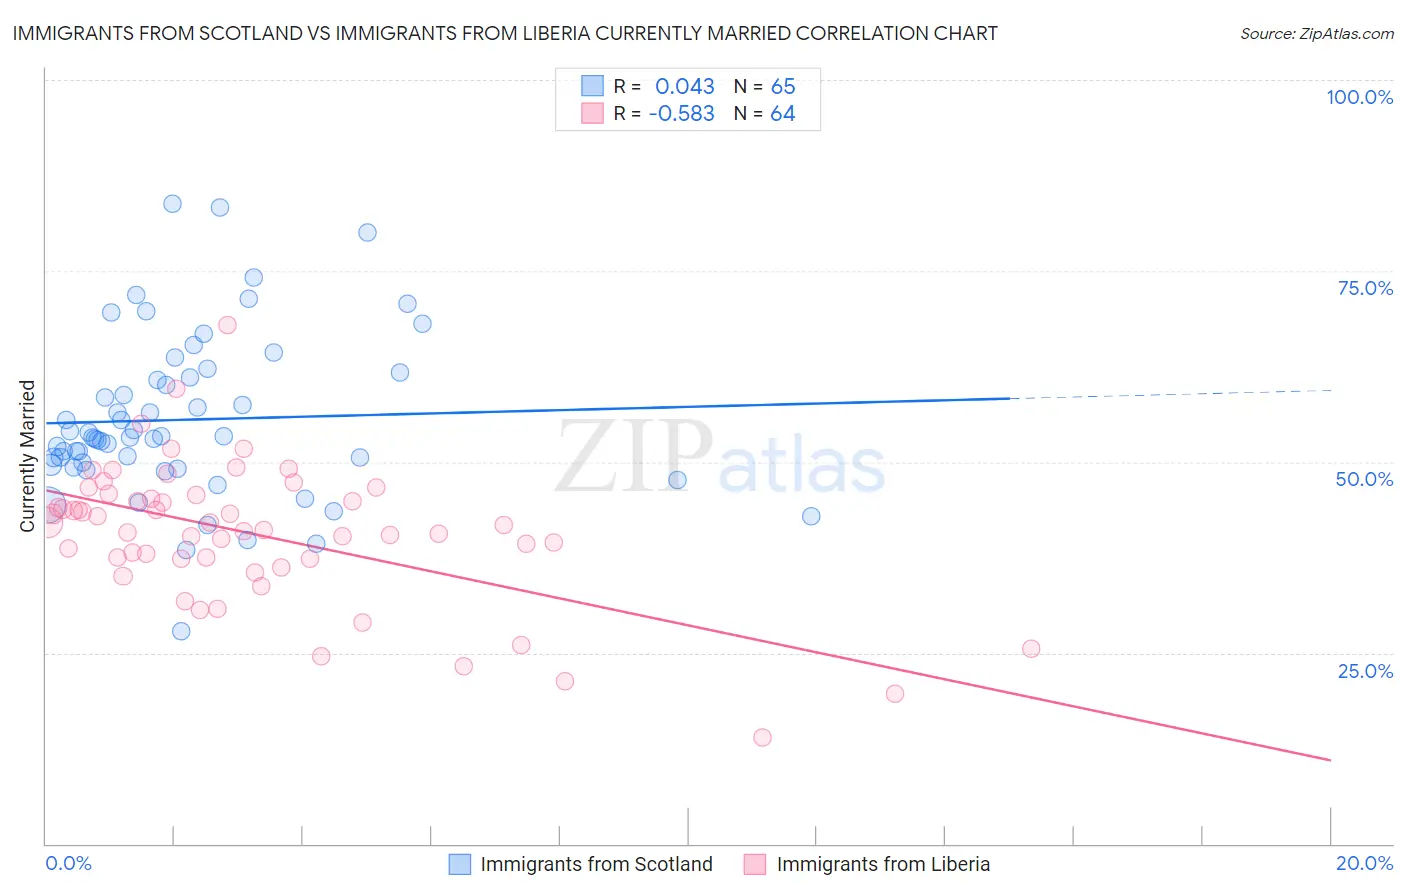
Immigrants from Scotland vs Immigrants from Liberia Currently Married Correlation Chart
The statistical analysis conducted on geographies consisting of 196,396,392 people shows no correlation between the proportion of Immigrants from Scotland and percentage of population currently married in the United States with a correlation coefficient (R) of 0.043 and weighted average of 49.3%. Similarly, the statistical analysis conducted on geographies consisting of 135,288,317 people shows a substantial negative correlation between the proportion of Immigrants from Liberia and percentage of population currently married in the United States with a correlation coefficient (R) of -0.583 and weighted average of 41.8%, a difference of 18.2%.
Currently Married Correlation Summary
| Measurement | Immigrants from Scotland | Immigrants from Liberia |
| Minimum | 27.9% | 13.9% |
| Maximum | 83.8% | 68.0% |
| Range | 55.9% | 54.1% |
| Mean | 55.5% | 40.5% |
| Median | 53.2% | 41.4% |
| Interquartile 25% (IQ1) | 49.5% | 37.3% |
| Interquartile 75% (IQ3) | 61.4% | 45.4% |
| Interquartile Range (IQR) | 11.9% | 8.2% |
| Standard Deviation (Sample) | 10.7% | 9.3% |
| Standard Deviation (Population) | 10.7% | 9.2% |
Similar Demographics by Currently Married
Demographics Similar to Immigrants from Scotland by Currently Married
In terms of currently married, the demographic groups most similar to Immigrants from Scotland are European (49.3%, a difference of 0.020%), Luxembourger (49.3%, a difference of 0.15%), Scottish (49.2%, a difference of 0.26%), Scandinavian (49.5%, a difference of 0.29%), and Chinese (49.5%, a difference of 0.31%).
| Demographics | Rating | Rank | Currently Married |
| English | 99.9 /100 | #11 | Exceptional 49.7% |
| Swiss | 99.9 /100 | #12 | Exceptional 49.7% |
| Dutch | 99.9 /100 | #13 | Exceptional 49.6% |
| Germans | 99.9 /100 | #14 | Exceptional 49.6% |
| Pennsylvania Germans | 99.9 /100 | #15 | Exceptional 49.6% |
| Chinese | 99.9 /100 | #16 | Exceptional 49.5% |
| Scandinavians | 99.9 /100 | #17 | Exceptional 49.5% |
| Immigrants | Scotland | 99.8 /100 | #18 | Exceptional 49.3% |
| Europeans | 99.8 /100 | #19 | Exceptional 49.3% |
| Luxembourgers | 99.8 /100 | #20 | Exceptional 49.3% |
| Scottish | 99.8 /100 | #21 | Exceptional 49.2% |
| Bulgarians | 99.7 /100 | #22 | Exceptional 49.1% |
| Immigrants | Pakistan | 99.7 /100 | #23 | Exceptional 49.1% |
| Lithuanians | 99.6 /100 | #24 | Exceptional 49.0% |
| Maltese | 99.6 /100 | #25 | Exceptional 49.0% |
Demographics Similar to Immigrants from Liberia by Currently Married
In terms of currently married, the demographic groups most similar to Immigrants from Liberia are Immigrants from Belize (41.8%, a difference of 0.11%), African (41.8%, a difference of 0.15%), Immigrants from Guyana (41.9%, a difference of 0.29%), Immigrants from Trinidad and Tobago (41.9%, a difference of 0.30%), and Immigrants from Bahamas (41.9%, a difference of 0.33%).
| Demographics | Rating | Rank | Currently Married |
| Immigrants | Zaire | 0.0 /100 | #302 | Tragic 42.0% |
| Sioux | 0.0 /100 | #303 | Tragic 41.9% |
| Immigrants | Bahamas | 0.0 /100 | #304 | Tragic 41.9% |
| Immigrants | Trinidad and Tobago | 0.0 /100 | #305 | Tragic 41.9% |
| Immigrants | Guyana | 0.0 /100 | #306 | Tragic 41.9% |
| Africans | 0.0 /100 | #307 | Tragic 41.8% |
| Immigrants | Belize | 0.0 /100 | #308 | Tragic 41.8% |
| Immigrants | Liberia | 0.0 /100 | #309 | Tragic 41.8% |
| Guyanese | 0.0 /100 | #310 | Tragic 41.6% |
| Trinidadians and Tobagonians | 0.0 /100 | #311 | Tragic 41.5% |
| Somalis | 0.0 /100 | #312 | Tragic 41.5% |
| Jamaicans | 0.0 /100 | #313 | Tragic 41.4% |
| West Indians | 0.0 /100 | #314 | Tragic 41.3% |
| Inupiat | 0.0 /100 | #315 | Tragic 41.3% |
| Immigrants | Caribbean | 0.0 /100 | #316 | Tragic 41.3% |