Samoan vs Immigrants from Colombia Disability Age 35 to 64
COMPARE
Samoan
Immigrants from Colombia
Disability Age 35 to 64
Disability Age 35 to 64 Comparison
Samoans
Immigrants from Colombia
12.1%
DISABILITY AGE 35 TO 64
2.8/ 100
METRIC RATING
242nd/ 347
METRIC RANK
9.8%
DISABILITY AGE 35 TO 64
99.9/ 100
METRIC RATING
43rd/ 347
METRIC RANK
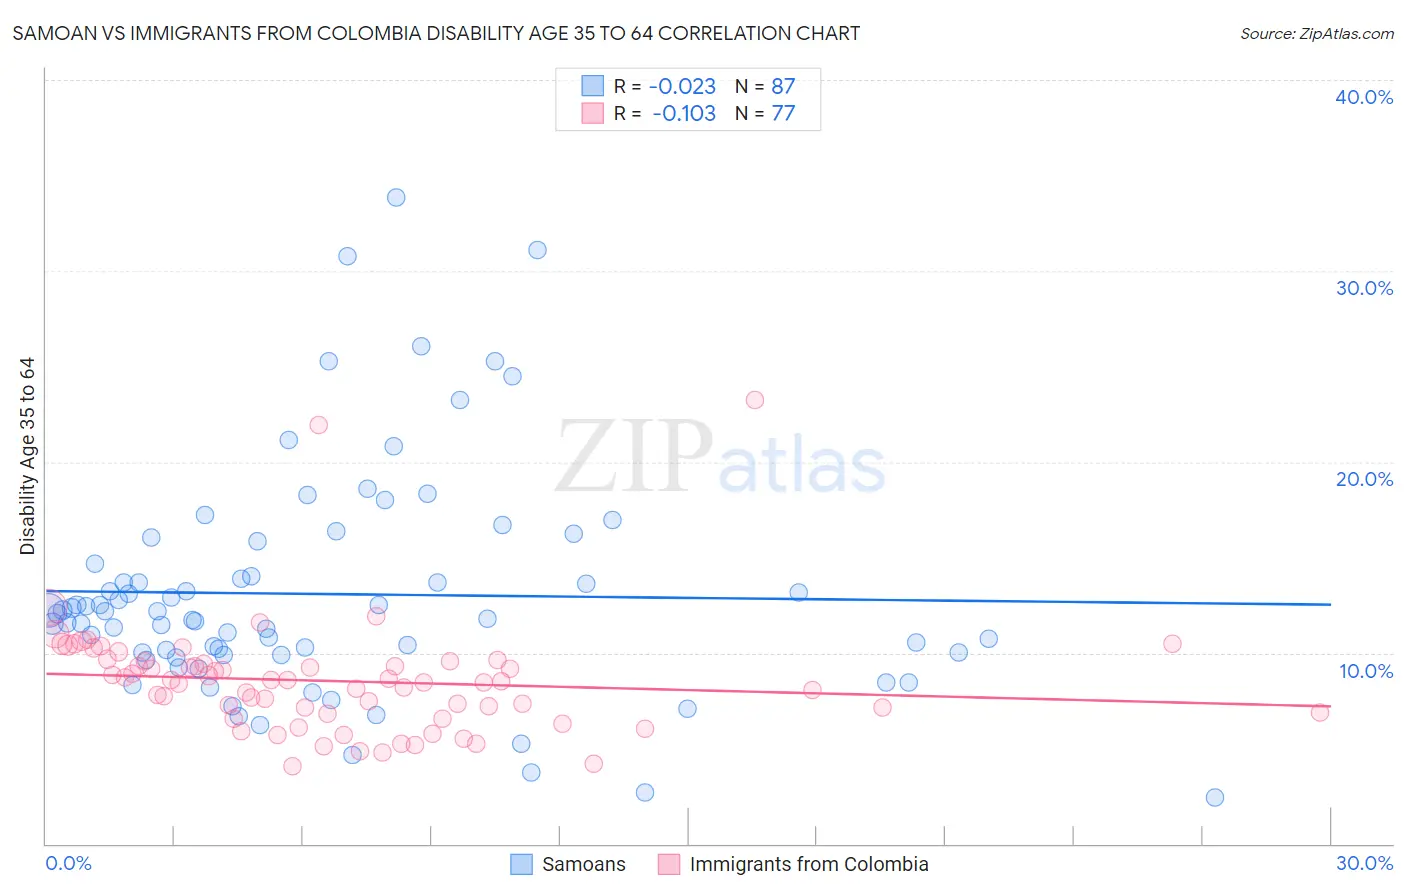
Samoan vs Immigrants from Colombia Disability Age 35 to 64 Correlation Chart
The statistical analysis conducted on geographies consisting of 225,063,493 people shows no correlation between the proportion of Samoans and percentage of population with a disability between the ages 34 and 64 in the United States with a correlation coefficient (R) of -0.023 and weighted average of 12.1%. Similarly, the statistical analysis conducted on geographies consisting of 378,497,907 people shows a poor negative correlation between the proportion of Immigrants from Colombia and percentage of population with a disability between the ages 34 and 64 in the United States with a correlation coefficient (R) of -0.103 and weighted average of 9.8%, a difference of 23.7%.
Disability Age 35 to 64 Correlation Summary
| Measurement | Samoan | Immigrants from Colombia |
| Minimum | 2.4% | 4.0% |
| Maximum | 33.9% | 23.3% |
| Range | 31.4% | 19.2% |
| Mean | 13.1% | 8.5% |
| Median | 12.0% | 8.5% |
| Interquartile 25% (IQ1) | 9.9% | 6.8% |
| Interquartile 75% (IQ3) | 14.6% | 9.6% |
| Interquartile Range (IQR) | 4.7% | 2.7% |
| Standard Deviation (Sample) | 6.0% | 3.0% |
| Standard Deviation (Population) | 5.9% | 3.0% |
Similar Demographics by Disability Age 35 to 64
Demographics Similar to Samoans by Disability Age 35 to 64
In terms of disability age 35 to 64, the demographic groups most similar to Samoans are Slovak (12.1%, a difference of 0.10%), Mexican American Indian (12.0%, a difference of 0.27%), Immigrants from Western Africa (12.0%, a difference of 0.30%), Immigrants from Thailand (12.0%, a difference of 0.30%), and Finnish (12.1%, a difference of 0.36%).
| Demographics | Rating | Rank | Disability Age 35 to 64 |
| Belizeans | 4.5 /100 | #235 | Tragic 12.0% |
| Immigrants | Middle Africa | 4.5 /100 | #236 | Tragic 12.0% |
| Immigrants | Cambodia | 3.9 /100 | #237 | Tragic 12.0% |
| West Indians | 3.7 /100 | #238 | Tragic 12.0% |
| Immigrants | Western Africa | 3.3 /100 | #239 | Tragic 12.0% |
| Immigrants | Thailand | 3.3 /100 | #240 | Tragic 12.0% |
| Mexican American Indians | 3.2 /100 | #241 | Tragic 12.0% |
| Samoans | 2.8 /100 | #242 | Tragic 12.1% |
| Slovaks | 2.7 /100 | #243 | Tragic 12.1% |
| Finns | 2.3 /100 | #244 | Tragic 12.1% |
| Immigrants | Mexico | 2.2 /100 | #245 | Tragic 12.1% |
| Guamanians/Chamorros | 1.4 /100 | #246 | Tragic 12.2% |
| Immigrants | Senegal | 1.3 /100 | #247 | Tragic 12.2% |
| Spaniards | 1.3 /100 | #248 | Tragic 12.3% |
| Hispanics or Latinos | 1.3 /100 | #249 | Tragic 12.3% |
Demographics Similar to Immigrants from Colombia by Disability Age 35 to 64
In terms of disability age 35 to 64, the demographic groups most similar to Immigrants from Colombia are Immigrants from Malaysia (9.7%, a difference of 0.12%), Immigrants from Egypt (9.8%, a difference of 0.29%), Israeli (9.7%, a difference of 0.35%), Immigrants from Peru (9.8%, a difference of 0.35%), and Immigrants from Armenia (9.7%, a difference of 0.47%).
| Demographics | Rating | Rank | Disability Age 35 to 64 |
| Immigrants | Cuba | 99.9 /100 | #36 | Exceptional 9.7% |
| Immigrants | Turkey | 99.9 /100 | #37 | Exceptional 9.7% |
| Egyptians | 99.9 /100 | #38 | Exceptional 9.7% |
| Immigrants | Belarus | 99.9 /100 | #39 | Exceptional 9.7% |
| Immigrants | Armenia | 99.9 /100 | #40 | Exceptional 9.7% |
| Israelis | 99.9 /100 | #41 | Exceptional 9.7% |
| Immigrants | Malaysia | 99.9 /100 | #42 | Exceptional 9.7% |
| Immigrants | Colombia | 99.9 /100 | #43 | Exceptional 9.8% |
| Immigrants | Egypt | 99.9 /100 | #44 | Exceptional 9.8% |
| Immigrants | Peru | 99.9 /100 | #45 | Exceptional 9.8% |
| Cambodians | 99.8 /100 | #46 | Exceptional 9.8% |
| Immigrants | Belgium | 99.8 /100 | #47 | Exceptional 9.8% |
| Immigrants | Serbia | 99.8 /100 | #48 | Exceptional 9.8% |
| Immigrants | Greece | 99.8 /100 | #49 | Exceptional 9.8% |
| Paraguayans | 99.8 /100 | #50 | Exceptional 9.8% |