Kenyan vs Immigrants from Colombia Currently Married
COMPARE
Kenyan
Immigrants from Colombia
Currently Married
Currently Married Comparison
Kenyans
Immigrants from Colombia
45.2%
CURRENTLY MARRIED
3.1/ 100
METRIC RATING
220th/ 347
METRIC RANK
46.1%
CURRENTLY MARRIED
21.0/ 100
METRIC RATING
198th/ 347
METRIC RANK
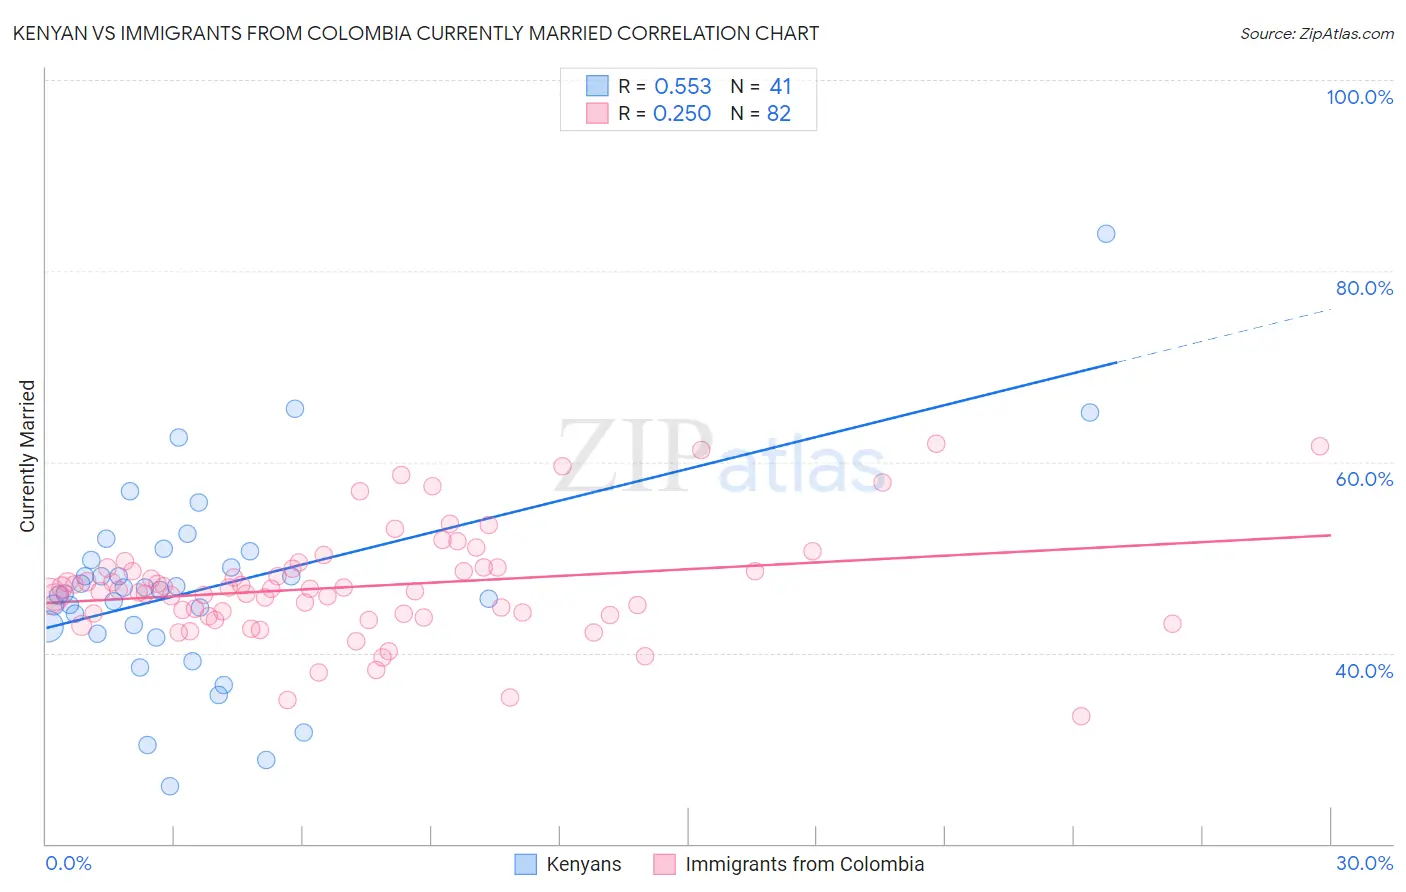
Kenyan vs Immigrants from Colombia Currently Married Correlation Chart
The statistical analysis conducted on geographies consisting of 168,238,911 people shows a substantial positive correlation between the proportion of Kenyans and percentage of population currently married in the United States with a correlation coefficient (R) of 0.553 and weighted average of 45.2%. Similarly, the statistical analysis conducted on geographies consisting of 378,670,909 people shows a weak positive correlation between the proportion of Immigrants from Colombia and percentage of population currently married in the United States with a correlation coefficient (R) of 0.250 and weighted average of 46.1%, a difference of 2.0%.
Currently Married Correlation Summary
| Measurement | Kenyan | Immigrants from Colombia |
| Minimum | 26.0% | 33.3% |
| Maximum | 83.9% | 61.9% |
| Range | 57.9% | 28.6% |
| Mean | 46.8% | 47.0% |
| Median | 46.5% | 46.5% |
| Interquartile 25% (IQ1) | 42.3% | 44.0% |
| Interquartile 75% (IQ3) | 50.1% | 48.9% |
| Interquartile Range (IQR) | 7.8% | 4.9% |
| Standard Deviation (Sample) | 10.4% | 5.6% |
| Standard Deviation (Population) | 10.3% | 5.6% |
Similar Demographics by Currently Married
Demographics Similar to Kenyans by Currently Married
In terms of currently married, the demographic groups most similar to Kenyans are Mexican (45.2%, a difference of 0.020%), Immigrants from Portugal (45.2%, a difference of 0.13%), Immigrants from the Azores (45.1%, a difference of 0.22%), Panamanian (45.3%, a difference of 0.24%), and Immigrants from Laos (45.0%, a difference of 0.30%).
| Demographics | Rating | Rank | Currently Married |
| Alaska Natives | 7.0 /100 | #213 | Tragic 45.5% |
| Dutch West Indians | 6.7 /100 | #214 | Tragic 45.5% |
| German Russians | 6.7 /100 | #215 | Tragic 45.5% |
| Immigrants | Morocco | 5.5 /100 | #216 | Tragic 45.4% |
| Immigrants | Thailand | 5.1 /100 | #217 | Tragic 45.4% |
| Panamanians | 4.0 /100 | #218 | Tragic 45.3% |
| Immigrants | Portugal | 3.5 /100 | #219 | Tragic 45.2% |
| Kenyans | 3.1 /100 | #220 | Tragic 45.2% |
| Mexicans | 3.0 /100 | #221 | Tragic 45.2% |
| Immigrants | Azores | 2.5 /100 | #222 | Tragic 45.1% |
| Immigrants | Laos | 2.3 /100 | #223 | Tragic 45.0% |
| Immigrants | Uganda | 2.2 /100 | #224 | Tragic 45.0% |
| French American Indians | 2.2 /100 | #225 | Tragic 45.0% |
| Comanche | 2.1 /100 | #226 | Tragic 45.0% |
| Spanish Americans | 2.1 /100 | #227 | Tragic 45.0% |
Demographics Similar to Immigrants from Colombia by Currently Married
In terms of currently married, the demographic groups most similar to Immigrants from Colombia are Immigrants from Kuwait (46.1%, a difference of 0.040%), Immigrants from Bosnia and Herzegovina (46.1%, a difference of 0.070%), Immigrants from Costa Rica (46.0%, a difference of 0.080%), Immigrants from Nepal (46.1%, a difference of 0.14%), and South American (46.1%, a difference of 0.15%).
| Demographics | Rating | Rank | Currently Married |
| Immigrants | France | 27.7 /100 | #191 | Fair 46.2% |
| Soviet Union | 25.7 /100 | #192 | Fair 46.2% |
| Immigrants | Fiji | 25.0 /100 | #193 | Fair 46.2% |
| South Americans | 23.8 /100 | #194 | Fair 46.1% |
| Immigrants | Nepal | 23.7 /100 | #195 | Fair 46.1% |
| Immigrants | Bosnia and Herzegovina | 22.2 /100 | #196 | Fair 46.1% |
| Immigrants | Kuwait | 21.7 /100 | #197 | Fair 46.1% |
| Immigrants | Colombia | 21.0 /100 | #198 | Fair 46.1% |
| Immigrants | Costa Rica | 19.6 /100 | #199 | Poor 46.0% |
| Creek | 17.2 /100 | #200 | Poor 46.0% |
| Malaysians | 15.3 /100 | #201 | Poor 45.9% |
| Immigrants | Albania | 14.5 /100 | #202 | Poor 45.9% |
| Taiwanese | 11.7 /100 | #203 | Poor 45.8% |
| Immigrants | Spain | 11.6 /100 | #204 | Poor 45.8% |
| South American Indians | 11.5 /100 | #205 | Poor 45.8% |