Ecuadorian vs Immigrants from Colombia Currently Married
COMPARE
Ecuadorian
Immigrants from Colombia
Currently Married
Currently Married Comparison
Ecuadorians
Immigrants from Colombia
43.6%
CURRENTLY MARRIED
0.1/ 100
METRIC RATING
266th/ 347
METRIC RANK
46.1%
CURRENTLY MARRIED
21.0/ 100
METRIC RATING
198th/ 347
METRIC RANK
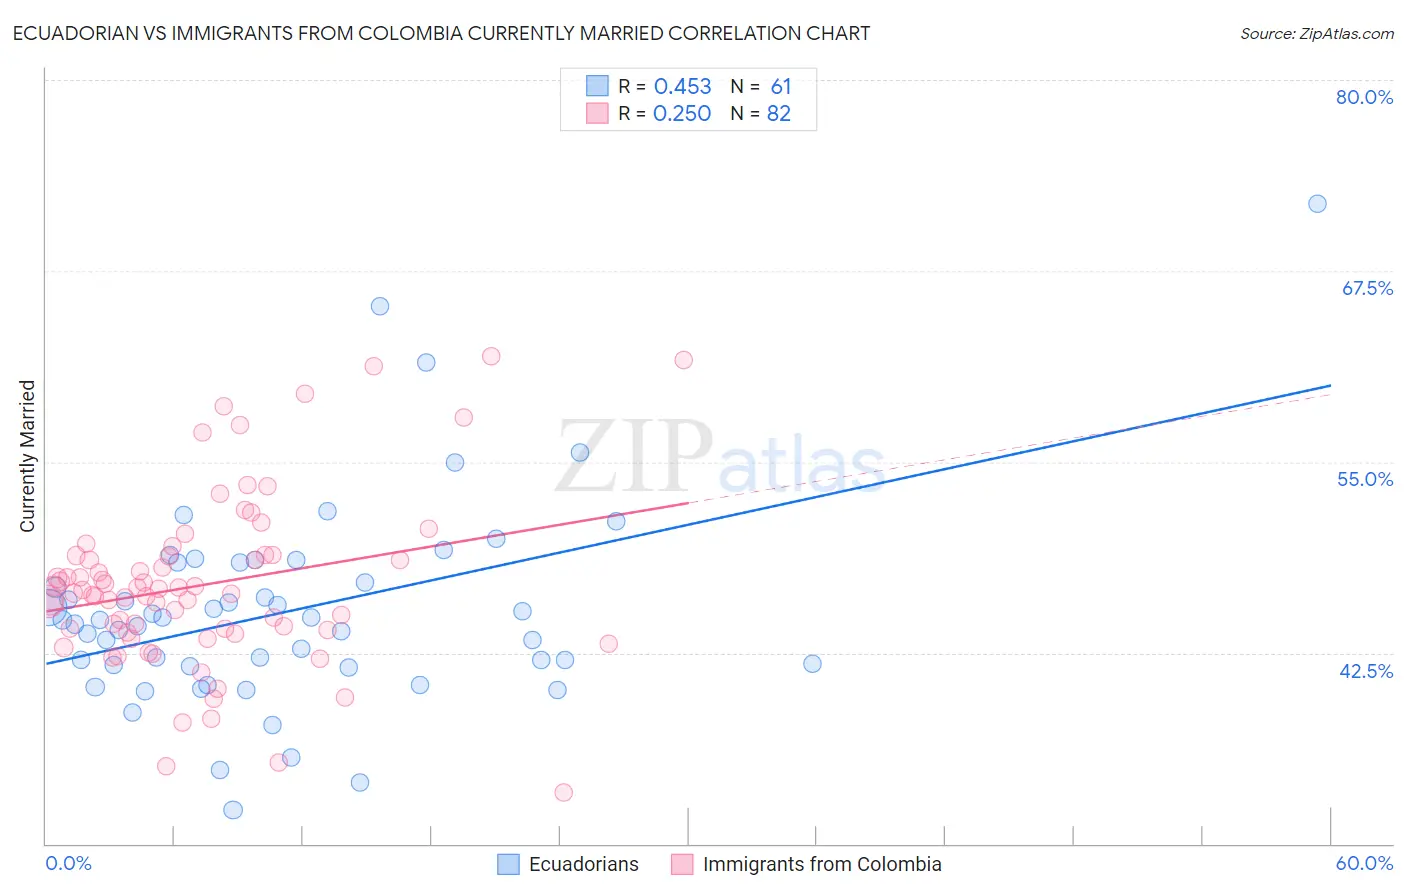
Ecuadorian vs Immigrants from Colombia Currently Married Correlation Chart
The statistical analysis conducted on geographies consisting of 317,807,476 people shows a moderate positive correlation between the proportion of Ecuadorians and percentage of population currently married in the United States with a correlation coefficient (R) of 0.453 and weighted average of 43.6%. Similarly, the statistical analysis conducted on geographies consisting of 378,670,909 people shows a weak positive correlation between the proportion of Immigrants from Colombia and percentage of population currently married in the United States with a correlation coefficient (R) of 0.250 and weighted average of 46.1%, a difference of 5.7%.
Currently Married Correlation Summary
| Measurement | Ecuadorian | Immigrants from Colombia |
| Minimum | 32.2% | 33.3% |
| Maximum | 71.9% | 61.9% |
| Range | 39.7% | 28.6% |
| Mean | 45.2% | 47.0% |
| Median | 44.6% | 46.5% |
| Interquartile 25% (IQ1) | 41.7% | 44.0% |
| Interquartile 75% (IQ3) | 48.4% | 48.9% |
| Interquartile Range (IQR) | 6.8% | 4.9% |
| Standard Deviation (Sample) | 6.7% | 5.6% |
| Standard Deviation (Population) | 6.7% | 5.6% |
Similar Demographics by Currently Married
Demographics Similar to Ecuadorians by Currently Married
In terms of currently married, the demographic groups most similar to Ecuadorians are Immigrants from Eritrea (43.6%, a difference of 0.030%), Spanish American Indian (43.6%, a difference of 0.030%), Immigrants from Bangladesh (43.6%, a difference of 0.070%), Sudanese (43.7%, a difference of 0.15%), and Immigrants from Cuba (43.7%, a difference of 0.16%).
| Demographics | Rating | Rank | Currently Married |
| Immigrants | Sierra Leone | 0.1 /100 | #259 | Tragic 43.8% |
| Immigrants | Latin America | 0.1 /100 | #260 | Tragic 43.8% |
| Immigrants | Nicaragua | 0.1 /100 | #261 | Tragic 43.7% |
| Bangladeshis | 0.1 /100 | #262 | Tragic 43.7% |
| Immigrants | Cuba | 0.1 /100 | #263 | Tragic 43.7% |
| Sudanese | 0.1 /100 | #264 | Tragic 43.7% |
| Immigrants | Bangladesh | 0.1 /100 | #265 | Tragic 43.6% |
| Ecuadorians | 0.1 /100 | #266 | Tragic 43.6% |
| Immigrants | Eritrea | 0.1 /100 | #267 | Tragic 43.6% |
| Spanish American Indians | 0.1 /100 | #268 | Tragic 43.6% |
| Immigrants | Sudan | 0.1 /100 | #269 | Tragic 43.5% |
| Salvadorans | 0.1 /100 | #270 | Tragic 43.5% |
| Bermudans | 0.1 /100 | #271 | Tragic 43.5% |
| Indonesians | 0.1 /100 | #272 | Tragic 43.5% |
| Yaqui | 0.1 /100 | #273 | Tragic 43.4% |
Demographics Similar to Immigrants from Colombia by Currently Married
In terms of currently married, the demographic groups most similar to Immigrants from Colombia are Immigrants from Kuwait (46.1%, a difference of 0.040%), Immigrants from Bosnia and Herzegovina (46.1%, a difference of 0.070%), Immigrants from Costa Rica (46.0%, a difference of 0.080%), Immigrants from Nepal (46.1%, a difference of 0.14%), and South American (46.1%, a difference of 0.15%).
| Demographics | Rating | Rank | Currently Married |
| Immigrants | France | 27.7 /100 | #191 | Fair 46.2% |
| Soviet Union | 25.7 /100 | #192 | Fair 46.2% |
| Immigrants | Fiji | 25.0 /100 | #193 | Fair 46.2% |
| South Americans | 23.8 /100 | #194 | Fair 46.1% |
| Immigrants | Nepal | 23.7 /100 | #195 | Fair 46.1% |
| Immigrants | Bosnia and Herzegovina | 22.2 /100 | #196 | Fair 46.1% |
| Immigrants | Kuwait | 21.7 /100 | #197 | Fair 46.1% |
| Immigrants | Colombia | 21.0 /100 | #198 | Fair 46.1% |
| Immigrants | Costa Rica | 19.6 /100 | #199 | Poor 46.0% |
| Creek | 17.2 /100 | #200 | Poor 46.0% |
| Malaysians | 15.3 /100 | #201 | Poor 45.9% |
| Immigrants | Albania | 14.5 /100 | #202 | Poor 45.9% |
| Taiwanese | 11.7 /100 | #203 | Poor 45.8% |
| Immigrants | Spain | 11.6 /100 | #204 | Poor 45.8% |
| South American Indians | 11.5 /100 | #205 | Poor 45.8% |