Samoan vs Immigrants from Cabo Verde Single Mother Households
COMPARE
Samoan
Immigrants from Cabo Verde
Single Mother Households
Single Mother Households Comparison
Samoans
Immigrants from Cabo Verde
6.5%
SINGLE MOTHER HOUSEHOLDS
21.2/ 100
METRIC RATING
191st/ 347
METRIC RANK
9.6%
SINGLE MOTHER HOUSEHOLDS
0.0/ 100
METRIC RATING
345th/ 347
METRIC RANK
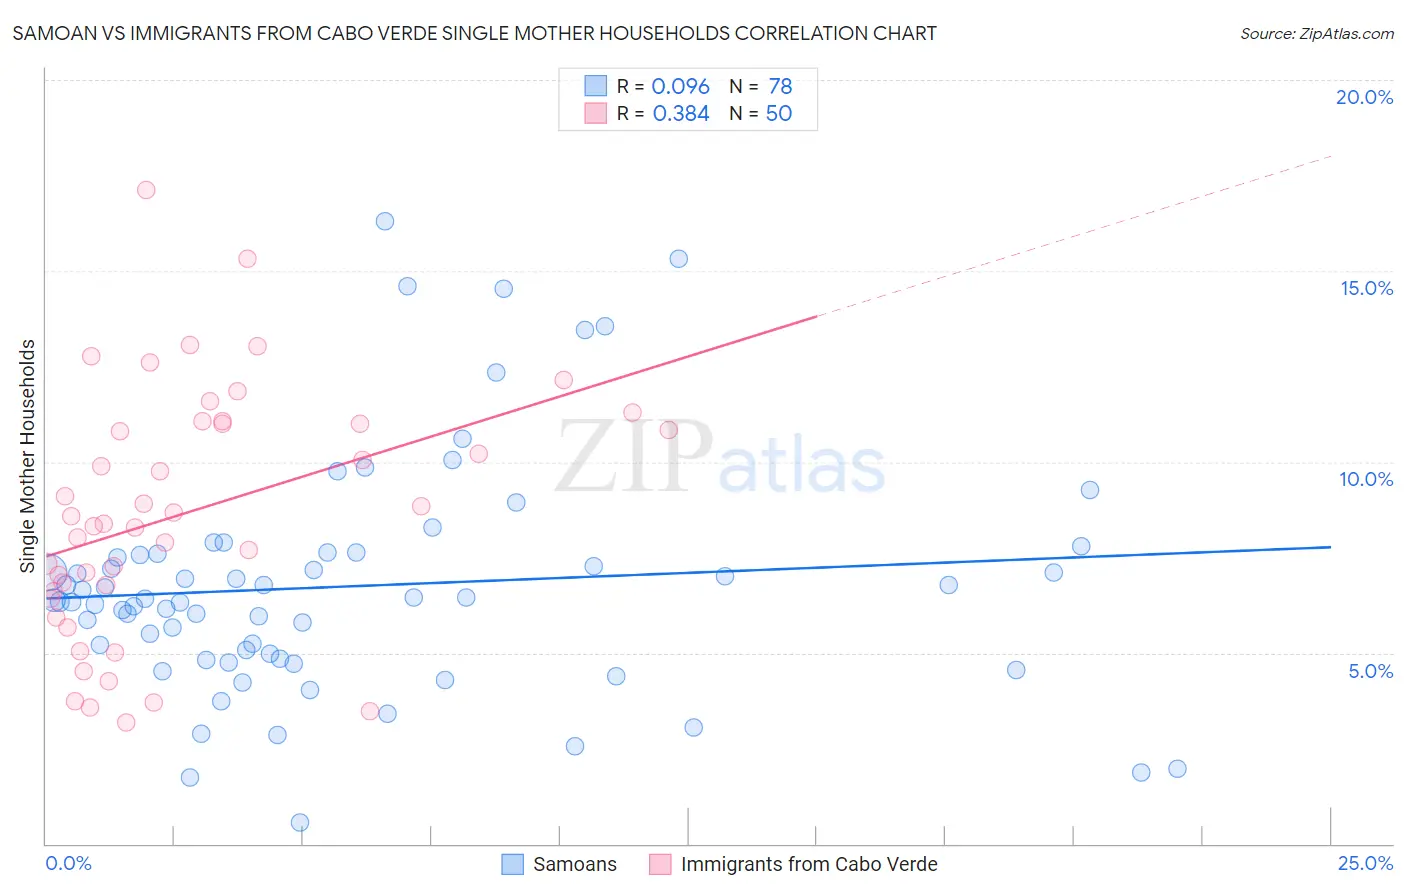
Samoan vs Immigrants from Cabo Verde Single Mother Households Correlation Chart
The statistical analysis conducted on geographies consisting of 224,902,643 people shows a slight positive correlation between the proportion of Samoans and percentage of single mother households in the United States with a correlation coefficient (R) of 0.096 and weighted average of 6.5%. Similarly, the statistical analysis conducted on geographies consisting of 38,117,400 people shows a mild positive correlation between the proportion of Immigrants from Cabo Verde and percentage of single mother households in the United States with a correlation coefficient (R) of 0.384 and weighted average of 9.6%, a difference of 46.5%.
Single Mother Households Correlation Summary
| Measurement | Samoan | Immigrants from Cabo Verde |
| Minimum | 0.57% | 3.2% |
| Maximum | 16.3% | 17.1% |
| Range | 15.7% | 13.9% |
| Mean | 6.7% | 8.7% |
| Median | 6.4% | 8.5% |
| Interquartile 25% (IQ1) | 4.8% | 6.6% |
| Interquartile 75% (IQ3) | 7.6% | 11.0% |
| Interquartile Range (IQR) | 2.7% | 4.4% |
| Standard Deviation (Sample) | 3.1% | 3.2% |
| Standard Deviation (Population) | 3.1% | 3.2% |
Similar Demographics by Single Mother Households
Demographics Similar to Samoans by Single Mother Households
In terms of single mother households, the demographic groups most similar to Samoans are Peruvian (6.5%, a difference of 0.060%), Delaware (6.5%, a difference of 0.32%), American (6.6%, a difference of 0.37%), Ottawa (6.5%, a difference of 0.39%), and Colombian (6.6%, a difference of 0.49%).
| Demographics | Rating | Rank | Single Mother Households |
| Ethiopians | 26.0 /100 | #184 | Fair 6.5% |
| Ugandans | 25.6 /100 | #185 | Fair 6.5% |
| Costa Ricans | 24.8 /100 | #186 | Fair 6.5% |
| Immigrants | Afghanistan | 24.7 /100 | #187 | Fair 6.5% |
| Ottawa | 23.8 /100 | #188 | Fair 6.5% |
| Delaware | 23.3 /100 | #189 | Fair 6.5% |
| Peruvians | 21.6 /100 | #190 | Fair 6.5% |
| Samoans | 21.2 /100 | #191 | Fair 6.5% |
| Americans | 19.0 /100 | #192 | Poor 6.6% |
| Colombians | 18.3 /100 | #193 | Poor 6.6% |
| Immigrants | Uganda | 18.3 /100 | #194 | Poor 6.6% |
| South Americans | 18.0 /100 | #195 | Poor 6.6% |
| Uruguayans | 18.0 /100 | #196 | Poor 6.6% |
| Moroccans | 17.4 /100 | #197 | Poor 6.6% |
| Hawaiians | 16.1 /100 | #198 | Poor 6.6% |
Demographics Similar to Immigrants from Cabo Verde by Single Mother Households
In terms of single mother households, the demographic groups most similar to Immigrants from Cabo Verde are Yuman (9.6%, a difference of 0.59%), Immigrants from Dominican Republic (9.5%, a difference of 0.78%), Dominican (9.2%, a difference of 4.3%), Yup'ik (10.0%, a difference of 4.4%), and Menominee (9.2%, a difference of 4.5%).
| Demographics | Rating | Rank | Single Mother Households |
| Liberians | 0.0 /100 | #333 | Tragic 8.6% |
| Immigrants | Liberia | 0.0 /100 | #334 | Tragic 8.7% |
| Immigrants | Dominica | 0.0 /100 | #335 | Tragic 8.7% |
| Puerto Ricans | 0.0 /100 | #336 | Tragic 8.7% |
| Navajo | 0.0 /100 | #337 | Tragic 8.8% |
| Cape Verdeans | 0.0 /100 | #338 | Tragic 8.9% |
| Blacks/African Americans | 0.0 /100 | #339 | Tragic 9.0% |
| Lumbee | 0.0 /100 | #340 | Tragic 9.1% |
| Tohono O'odham | 0.0 /100 | #341 | Tragic 9.1% |
| Menominee | 0.0 /100 | #342 | Tragic 9.2% |
| Dominicans | 0.0 /100 | #343 | Tragic 9.2% |
| Immigrants | Dominican Republic | 0.0 /100 | #344 | Tragic 9.5% |
| Immigrants | Cabo Verde | 0.0 /100 | #345 | Tragic 9.6% |
| Yuman | 0.0 /100 | #346 | Tragic 9.6% |
| Yup'ik | 0.0 /100 | #347 | Tragic 10.0% |