Samoan vs Immigrants from Switzerland Single Mother Households
COMPARE
Samoan
Immigrants from Switzerland
Single Mother Households
Single Mother Households Comparison
Samoans
Immigrants from Switzerland
6.5%
SINGLE MOTHER HOUSEHOLDS
21.2/ 100
METRIC RATING
191st/ 347
METRIC RANK
5.3%
SINGLE MOTHER HOUSEHOLDS
99.7/ 100
METRIC RATING
33rd/ 347
METRIC RANK
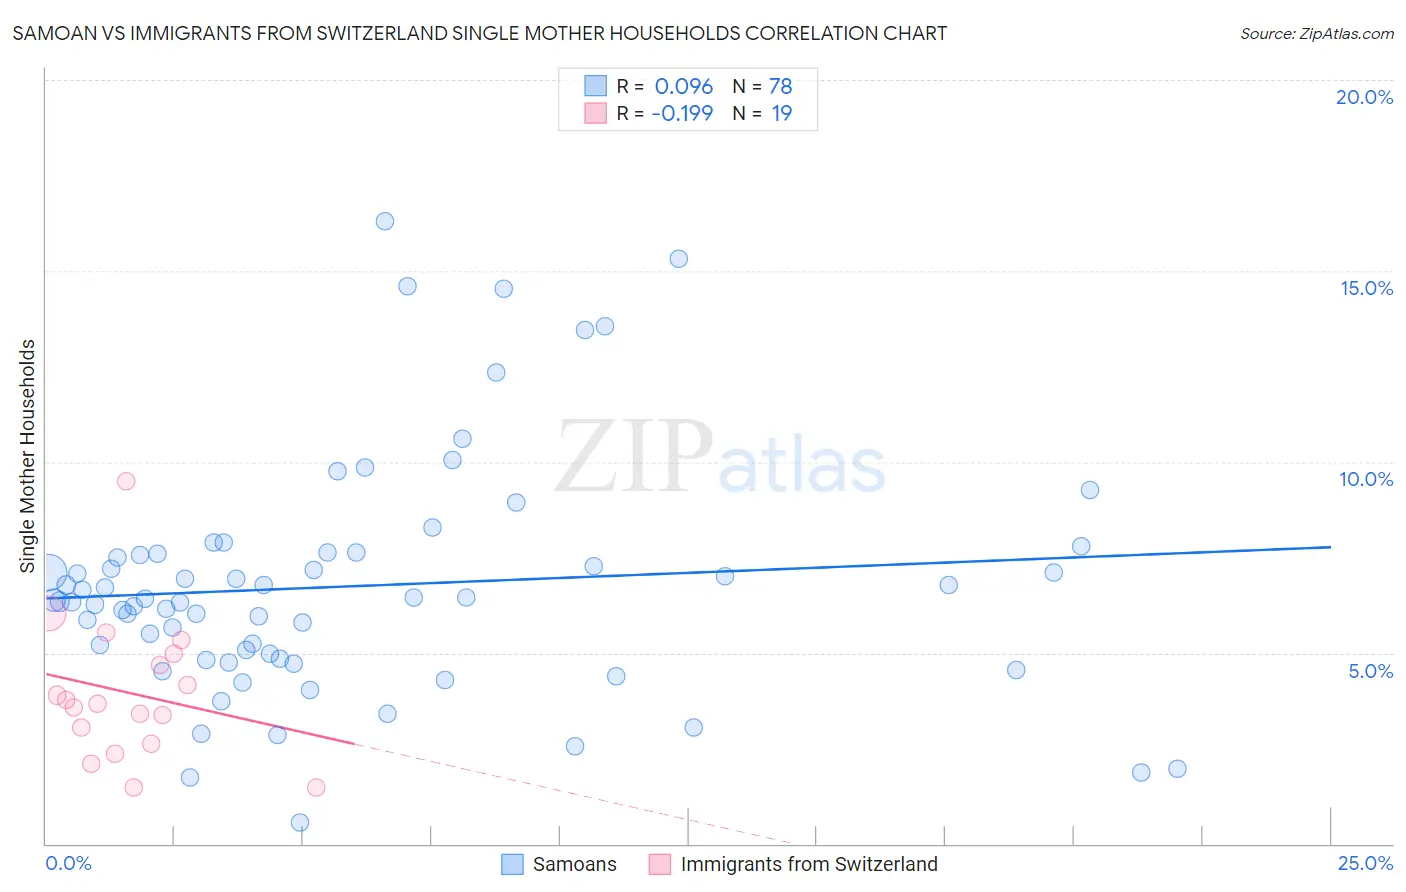
Samoan vs Immigrants from Switzerland Single Mother Households Correlation Chart
The statistical analysis conducted on geographies consisting of 224,902,643 people shows a slight positive correlation between the proportion of Samoans and percentage of single mother households in the United States with a correlation coefficient (R) of 0.096 and weighted average of 6.5%. Similarly, the statistical analysis conducted on geographies consisting of 147,838,806 people shows a poor negative correlation between the proportion of Immigrants from Switzerland and percentage of single mother households in the United States with a correlation coefficient (R) of -0.199 and weighted average of 5.3%, a difference of 23.1%.
Single Mother Households Correlation Summary
| Measurement | Samoan | Immigrants from Switzerland |
| Minimum | 0.57% | 1.5% |
| Maximum | 16.3% | 9.5% |
| Range | 15.7% | 8.0% |
| Mean | 6.7% | 3.9% |
| Median | 6.4% | 3.7% |
| Interquartile 25% (IQ1) | 4.8% | 2.6% |
| Interquartile 75% (IQ3) | 7.6% | 5.0% |
| Interquartile Range (IQR) | 2.7% | 2.3% |
| Standard Deviation (Sample) | 3.1% | 1.9% |
| Standard Deviation (Population) | 3.1% | 1.8% |
Similar Demographics by Single Mother Households
Demographics Similar to Samoans by Single Mother Households
In terms of single mother households, the demographic groups most similar to Samoans are Peruvian (6.5%, a difference of 0.060%), Delaware (6.5%, a difference of 0.32%), American (6.6%, a difference of 0.37%), Ottawa (6.5%, a difference of 0.39%), and Colombian (6.6%, a difference of 0.49%).
| Demographics | Rating | Rank | Single Mother Households |
| Ethiopians | 26.0 /100 | #184 | Fair 6.5% |
| Ugandans | 25.6 /100 | #185 | Fair 6.5% |
| Costa Ricans | 24.8 /100 | #186 | Fair 6.5% |
| Immigrants | Afghanistan | 24.7 /100 | #187 | Fair 6.5% |
| Ottawa | 23.8 /100 | #188 | Fair 6.5% |
| Delaware | 23.3 /100 | #189 | Fair 6.5% |
| Peruvians | 21.6 /100 | #190 | Fair 6.5% |
| Samoans | 21.2 /100 | #191 | Fair 6.5% |
| Americans | 19.0 /100 | #192 | Poor 6.6% |
| Colombians | 18.3 /100 | #193 | Poor 6.6% |
| Immigrants | Uganda | 18.3 /100 | #194 | Poor 6.6% |
| South Americans | 18.0 /100 | #195 | Poor 6.6% |
| Uruguayans | 18.0 /100 | #196 | Poor 6.6% |
| Moroccans | 17.4 /100 | #197 | Poor 6.6% |
| Hawaiians | 16.1 /100 | #198 | Poor 6.6% |
Demographics Similar to Immigrants from Switzerland by Single Mother Households
In terms of single mother households, the demographic groups most similar to Immigrants from Switzerland are Bulgarian (5.3%, a difference of 0.020%), Immigrants from Northern Europe (5.3%, a difference of 0.060%), Immigrants from Czechoslovakia (5.3%, a difference of 0.26%), Cambodian (5.3%, a difference of 0.38%), and Immigrants from Korea (5.3%, a difference of 0.39%).
| Demographics | Rating | Rank | Single Mother Households |
| Immigrants | Lithuania | 99.8 /100 | #26 | Exceptional 5.3% |
| Bhutanese | 99.7 /100 | #27 | Exceptional 5.3% |
| Russians | 99.7 /100 | #28 | Exceptional 5.3% |
| Latvians | 99.7 /100 | #29 | Exceptional 5.3% |
| Burmese | 99.7 /100 | #30 | Exceptional 5.3% |
| Immigrants | Korea | 99.7 /100 | #31 | Exceptional 5.3% |
| Cambodians | 99.7 /100 | #32 | Exceptional 5.3% |
| Immigrants | Switzerland | 99.7 /100 | #33 | Exceptional 5.3% |
| Bulgarians | 99.7 /100 | #34 | Exceptional 5.3% |
| Immigrants | Northern Europe | 99.7 /100 | #35 | Exceptional 5.3% |
| Immigrants | Czechoslovakia | 99.7 /100 | #36 | Exceptional 5.3% |
| Immigrants | Belgium | 99.7 /100 | #37 | Exceptional 5.3% |
| Immigrants | Serbia | 99.6 /100 | #38 | Exceptional 5.4% |
| Immigrants | Sweden | 99.6 /100 | #39 | Exceptional 5.4% |
| Estonians | 99.6 /100 | #40 | Exceptional 5.4% |