Samoan vs Immigrants from Micronesia Single Mother Households
COMPARE
Samoan
Immigrants from Micronesia
Single Mother Households
Single Mother Households Comparison
Samoans
Immigrants from Micronesia
6.5%
SINGLE MOTHER HOUSEHOLDS
21.2/ 100
METRIC RATING
191st/ 347
METRIC RANK
6.9%
SINGLE MOTHER HOUSEHOLDS
3.6/ 100
METRIC RATING
223rd/ 347
METRIC RANK
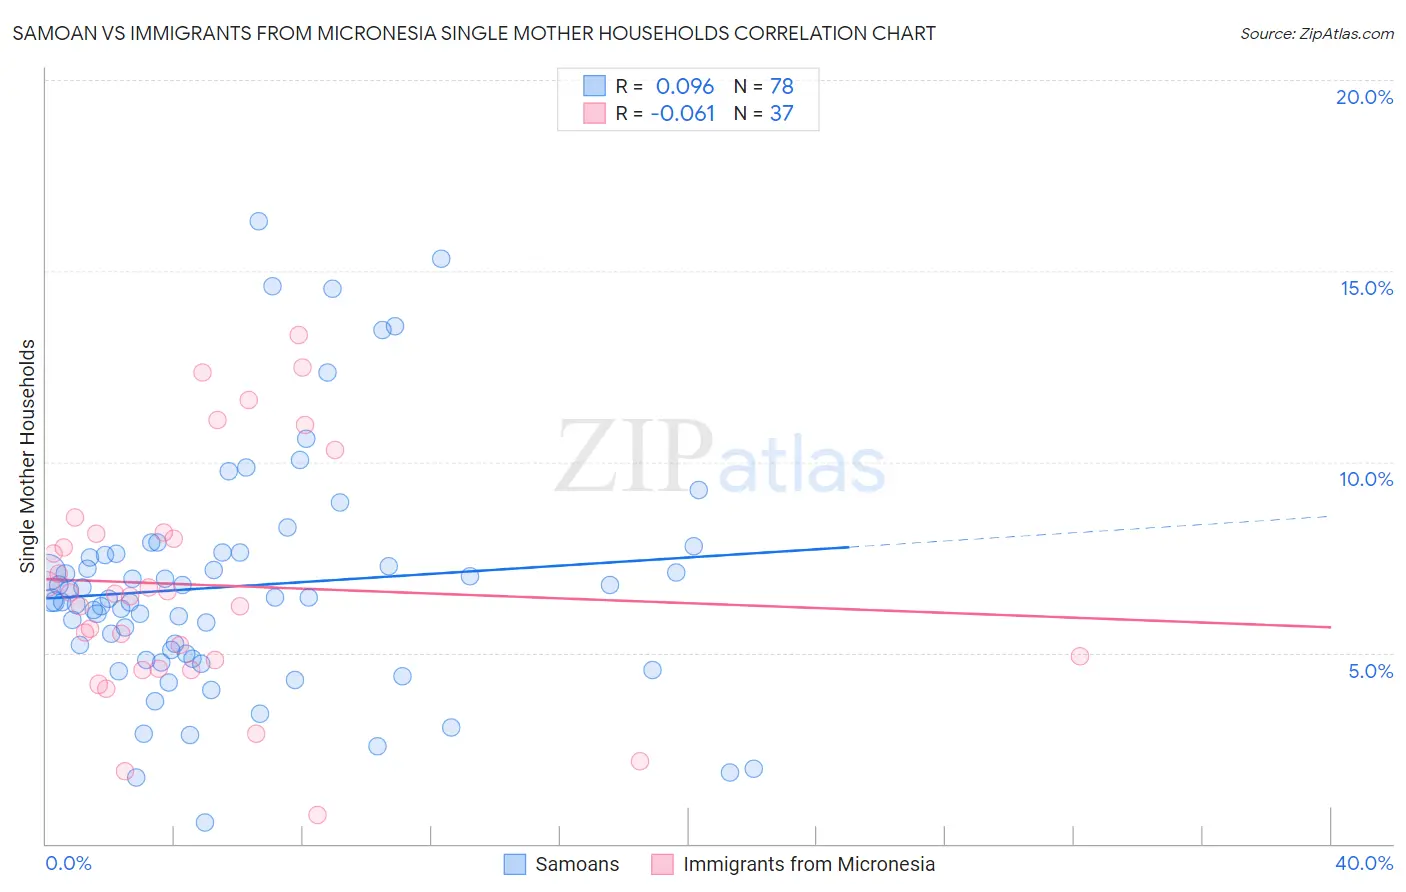
Samoan vs Immigrants from Micronesia Single Mother Households Correlation Chart
The statistical analysis conducted on geographies consisting of 224,902,643 people shows a slight positive correlation between the proportion of Samoans and percentage of single mother households in the United States with a correlation coefficient (R) of 0.096 and weighted average of 6.5%. Similarly, the statistical analysis conducted on geographies consisting of 61,584,620 people shows a slight negative correlation between the proportion of Immigrants from Micronesia and percentage of single mother households in the United States with a correlation coefficient (R) of -0.061 and weighted average of 6.9%, a difference of 5.2%.
Single Mother Households Correlation Summary
| Measurement | Samoan | Immigrants from Micronesia |
| Minimum | 0.57% | 0.77% |
| Maximum | 16.3% | 13.3% |
| Range | 15.7% | 12.5% |
| Mean | 6.7% | 6.8% |
| Median | 6.4% | 6.5% |
| Interquartile 25% (IQ1) | 4.8% | 4.7% |
| Interquartile 75% (IQ3) | 7.6% | 8.1% |
| Interquartile Range (IQR) | 2.7% | 3.4% |
| Standard Deviation (Sample) | 3.1% | 3.0% |
| Standard Deviation (Population) | 3.1% | 3.0% |
Similar Demographics by Single Mother Households
Demographics Similar to Samoans by Single Mother Households
In terms of single mother households, the demographic groups most similar to Samoans are Peruvian (6.5%, a difference of 0.060%), Delaware (6.5%, a difference of 0.32%), American (6.6%, a difference of 0.37%), Ottawa (6.5%, a difference of 0.39%), and Colombian (6.6%, a difference of 0.49%).
| Demographics | Rating | Rank | Single Mother Households |
| Ethiopians | 26.0 /100 | #184 | Fair 6.5% |
| Ugandans | 25.6 /100 | #185 | Fair 6.5% |
| Costa Ricans | 24.8 /100 | #186 | Fair 6.5% |
| Immigrants | Afghanistan | 24.7 /100 | #187 | Fair 6.5% |
| Ottawa | 23.8 /100 | #188 | Fair 6.5% |
| Delaware | 23.3 /100 | #189 | Fair 6.5% |
| Peruvians | 21.6 /100 | #190 | Fair 6.5% |
| Samoans | 21.2 /100 | #191 | Fair 6.5% |
| Americans | 19.0 /100 | #192 | Poor 6.6% |
| Colombians | 18.3 /100 | #193 | Poor 6.6% |
| Immigrants | Uganda | 18.3 /100 | #194 | Poor 6.6% |
| South Americans | 18.0 /100 | #195 | Poor 6.6% |
| Uruguayans | 18.0 /100 | #196 | Poor 6.6% |
| Moroccans | 17.4 /100 | #197 | Poor 6.6% |
| Hawaiians | 16.1 /100 | #198 | Poor 6.6% |
Demographics Similar to Immigrants from Micronesia by Single Mother Households
In terms of single mother households, the demographic groups most similar to Immigrants from Micronesia are Immigrants from Bangladesh (6.9%, a difference of 0.050%), French American Indian (6.9%, a difference of 0.070%), Immigrants from Sudan (6.9%, a difference of 0.12%), Immigrants from Thailand (6.9%, a difference of 0.26%), and Sudanese (6.9%, a difference of 0.39%).
| Demographics | Rating | Rank | Single Mother Households |
| Cherokee | 5.1 /100 | #216 | Tragic 6.8% |
| Aleuts | 4.8 /100 | #217 | Tragic 6.8% |
| Immigrants | Eastern Africa | 4.4 /100 | #218 | Tragic 6.8% |
| Immigrants | Immigrants | 4.3 /100 | #219 | Tragic 6.8% |
| Immigrants | Thailand | 4.0 /100 | #220 | Tragic 6.9% |
| French American Indians | 3.7 /100 | #221 | Tragic 6.9% |
| Immigrants | Bangladesh | 3.7 /100 | #222 | Tragic 6.9% |
| Immigrants | Micronesia | 3.6 /100 | #223 | Tragic 6.9% |
| Immigrants | Sudan | 3.5 /100 | #224 | Tragic 6.9% |
| Sudanese | 3.1 /100 | #225 | Tragic 6.9% |
| Paiute | 2.4 /100 | #226 | Tragic 7.0% |
| Kenyans | 2.3 /100 | #227 | Tragic 7.0% |
| Iroquois | 2.2 /100 | #228 | Tragic 7.0% |
| Immigrants | Kenya | 2.1 /100 | #229 | Tragic 7.0% |
| Creek | 1.6 /100 | #230 | Tragic 7.0% |