Samoan vs British West Indian Single Mother Households
COMPARE
Samoan
British West Indian
Single Mother Households
Single Mother Households Comparison
Samoans
British West Indians
6.5%
SINGLE MOTHER HOUSEHOLDS
21.2/ 100
METRIC RATING
191st/ 347
METRIC RANK
8.4%
SINGLE MOTHER HOUSEHOLDS
0.0/ 100
METRIC RATING
326th/ 347
METRIC RANK
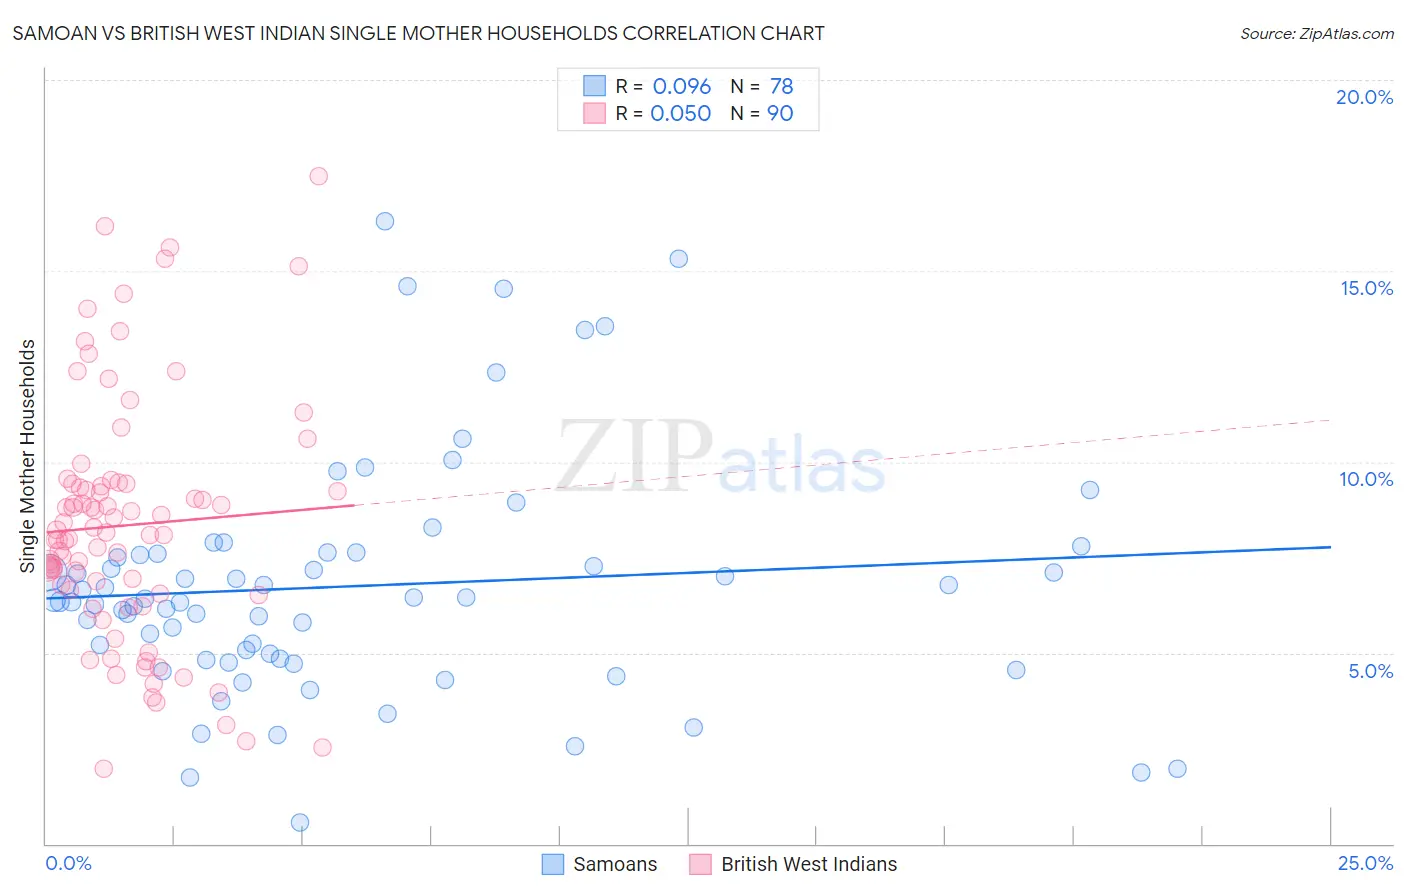
Samoan vs British West Indian Single Mother Households Correlation Chart
The statistical analysis conducted on geographies consisting of 224,902,643 people shows a slight positive correlation between the proportion of Samoans and percentage of single mother households in the United States with a correlation coefficient (R) of 0.096 and weighted average of 6.5%. Similarly, the statistical analysis conducted on geographies consisting of 152,574,422 people shows no correlation between the proportion of British West Indians and percentage of single mother households in the United States with a correlation coefficient (R) of 0.050 and weighted average of 8.4%, a difference of 28.3%.
Single Mother Households Correlation Summary
| Measurement | Samoan | British West Indian |
| Minimum | 0.57% | 2.0% |
| Maximum | 16.3% | 17.5% |
| Range | 15.7% | 15.5% |
| Mean | 6.7% | 8.3% |
| Median | 6.4% | 8.1% |
| Interquartile 25% (IQ1) | 4.8% | 6.5% |
| Interquartile 75% (IQ3) | 7.6% | 9.4% |
| Interquartile Range (IQR) | 2.7% | 2.9% |
| Standard Deviation (Sample) | 3.1% | 3.2% |
| Standard Deviation (Population) | 3.1% | 3.2% |
Similar Demographics by Single Mother Households
Demographics Similar to Samoans by Single Mother Households
In terms of single mother households, the demographic groups most similar to Samoans are Peruvian (6.5%, a difference of 0.060%), Delaware (6.5%, a difference of 0.32%), American (6.6%, a difference of 0.37%), Ottawa (6.5%, a difference of 0.39%), and Colombian (6.6%, a difference of 0.49%).
| Demographics | Rating | Rank | Single Mother Households |
| Ethiopians | 26.0 /100 | #184 | Fair 6.5% |
| Ugandans | 25.6 /100 | #185 | Fair 6.5% |
| Costa Ricans | 24.8 /100 | #186 | Fair 6.5% |
| Immigrants | Afghanistan | 24.7 /100 | #187 | Fair 6.5% |
| Ottawa | 23.8 /100 | #188 | Fair 6.5% |
| Delaware | 23.3 /100 | #189 | Fair 6.5% |
| Peruvians | 21.6 /100 | #190 | Fair 6.5% |
| Samoans | 21.2 /100 | #191 | Fair 6.5% |
| Americans | 19.0 /100 | #192 | Poor 6.6% |
| Colombians | 18.3 /100 | #193 | Poor 6.6% |
| Immigrants | Uganda | 18.3 /100 | #194 | Poor 6.6% |
| South Americans | 18.0 /100 | #195 | Poor 6.6% |
| Uruguayans | 18.0 /100 | #196 | Poor 6.6% |
| Moroccans | 17.4 /100 | #197 | Poor 6.6% |
| Hawaiians | 16.1 /100 | #198 | Poor 6.6% |
Demographics Similar to British West Indians by Single Mother Households
In terms of single mother households, the demographic groups most similar to British West Indians are Immigrants from Caribbean (8.4%, a difference of 0.12%), Immigrants from Haiti (8.4%, a difference of 0.15%), Immigrants from Jamaica (8.4%, a difference of 0.31%), Yakama (8.4%, a difference of 0.32%), and Haitian (8.3%, a difference of 0.74%).
| Demographics | Rating | Rank | Single Mother Households |
| Jamaicans | 0.0 /100 | #319 | Tragic 8.2% |
| Bahamians | 0.0 /100 | #320 | Tragic 8.3% |
| Immigrants | Senegal | 0.0 /100 | #321 | Tragic 8.3% |
| Pima | 0.0 /100 | #322 | Tragic 8.3% |
| Haitians | 0.0 /100 | #323 | Tragic 8.3% |
| Immigrants | Jamaica | 0.0 /100 | #324 | Tragic 8.4% |
| Immigrants | Caribbean | 0.0 /100 | #325 | Tragic 8.4% |
| British West Indians | 0.0 /100 | #326 | Tragic 8.4% |
| Immigrants | Haiti | 0.0 /100 | #327 | Tragic 8.4% |
| Yakama | 0.0 /100 | #328 | Tragic 8.4% |
| Hopi | 0.0 /100 | #329 | Tragic 8.5% |
| Inupiat | 0.0 /100 | #330 | Tragic 8.5% |
| Sioux | 0.0 /100 | #331 | Tragic 8.5% |
| U.S. Virgin Islanders | 0.0 /100 | #332 | Tragic 8.6% |
| Liberians | 0.0 /100 | #333 | Tragic 8.6% |