Latvian vs Immigrants from Cabo Verde Single Mother Households
COMPARE
Latvian
Immigrants from Cabo Verde
Single Mother Households
Single Mother Households Comparison
Latvians
Immigrants from Cabo Verde
5.3%
SINGLE MOTHER HOUSEHOLDS
99.7/ 100
METRIC RATING
29th/ 347
METRIC RANK
9.6%
SINGLE MOTHER HOUSEHOLDS
0.0/ 100
METRIC RATING
345th/ 347
METRIC RANK
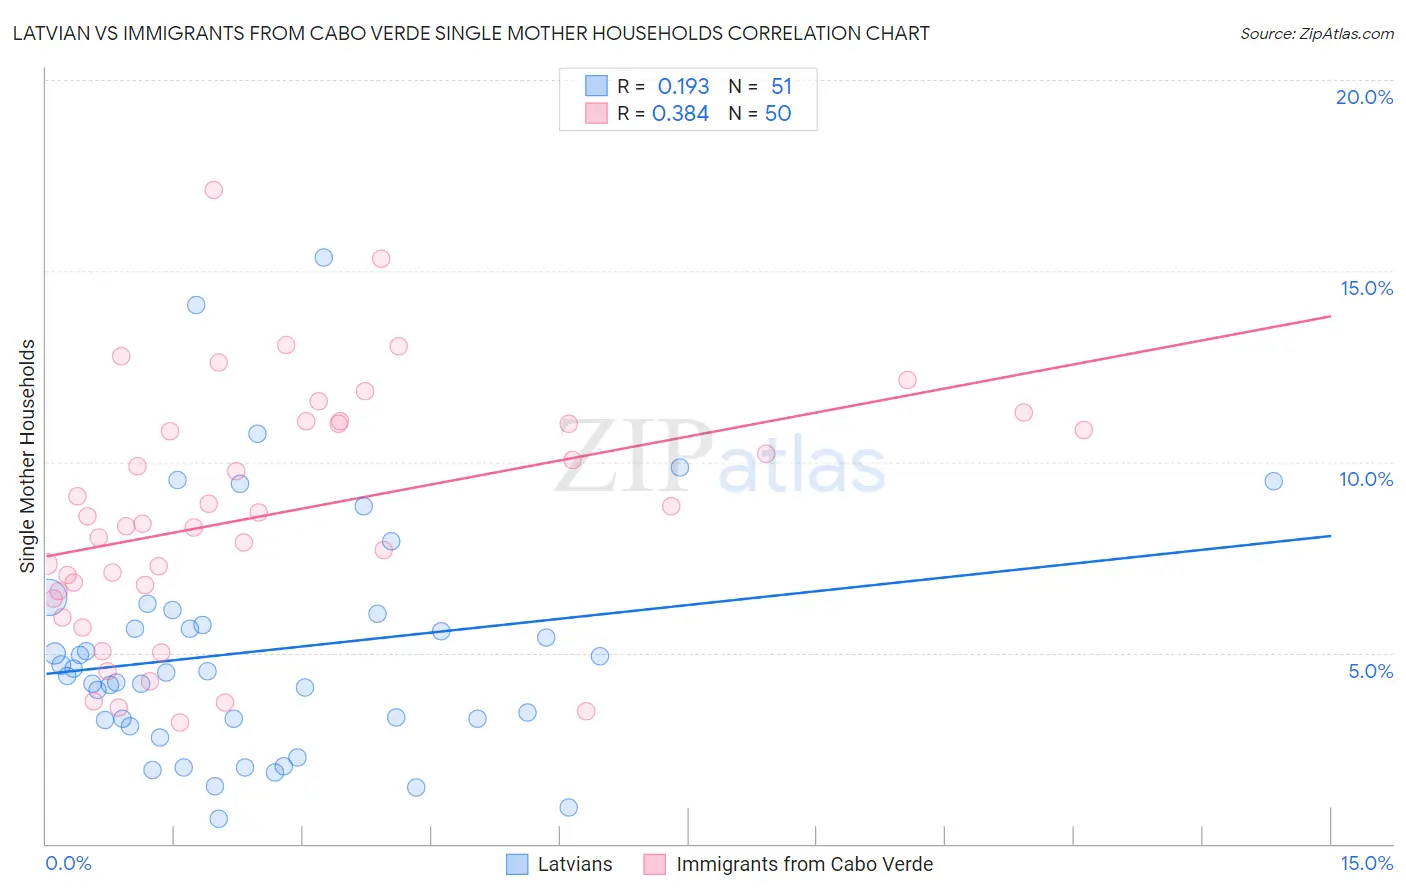
Latvian vs Immigrants from Cabo Verde Single Mother Households Correlation Chart
The statistical analysis conducted on geographies consisting of 220,091,303 people shows a poor positive correlation between the proportion of Latvians and percentage of single mother households in the United States with a correlation coefficient (R) of 0.193 and weighted average of 5.3%. Similarly, the statistical analysis conducted on geographies consisting of 38,117,400 people shows a mild positive correlation between the proportion of Immigrants from Cabo Verde and percentage of single mother households in the United States with a correlation coefficient (R) of 0.384 and weighted average of 9.6%, a difference of 81.2%.
Single Mother Households Correlation Summary
| Measurement | Latvian | Immigrants from Cabo Verde |
| Minimum | 0.66% | 3.2% |
| Maximum | 15.3% | 17.1% |
| Range | 14.7% | 13.9% |
| Mean | 5.1% | 8.7% |
| Median | 4.5% | 8.5% |
| Interquartile 25% (IQ1) | 3.3% | 6.6% |
| Interquartile 75% (IQ3) | 6.0% | 11.0% |
| Interquartile Range (IQR) | 2.8% | 4.4% |
| Standard Deviation (Sample) | 3.1% | 3.2% |
| Standard Deviation (Population) | 3.1% | 3.2% |
Similar Demographics by Single Mother Households
Demographics Similar to Latvians by Single Mother Households
In terms of single mother households, the demographic groups most similar to Latvians are Russian (5.3%, a difference of 0.010%), Burmese (5.3%, a difference of 0.060%), Immigrants from Korea (5.3%, a difference of 0.070%), Cambodian (5.3%, a difference of 0.070%), and Bhutanese (5.3%, a difference of 0.12%).
| Demographics | Rating | Rank | Single Mother Households |
| Thais | 99.8 /100 | #22 | Exceptional 5.2% |
| Immigrants | Austria | 99.8 /100 | #23 | Exceptional 5.2% |
| Armenians | 99.8 /100 | #24 | Exceptional 5.2% |
| Immigrants | Japan | 99.8 /100 | #25 | Exceptional 5.2% |
| Immigrants | Lithuania | 99.8 /100 | #26 | Exceptional 5.3% |
| Bhutanese | 99.7 /100 | #27 | Exceptional 5.3% |
| Russians | 99.7 /100 | #28 | Exceptional 5.3% |
| Latvians | 99.7 /100 | #29 | Exceptional 5.3% |
| Burmese | 99.7 /100 | #30 | Exceptional 5.3% |
| Immigrants | Korea | 99.7 /100 | #31 | Exceptional 5.3% |
| Cambodians | 99.7 /100 | #32 | Exceptional 5.3% |
| Immigrants | Switzerland | 99.7 /100 | #33 | Exceptional 5.3% |
| Bulgarians | 99.7 /100 | #34 | Exceptional 5.3% |
| Immigrants | Northern Europe | 99.7 /100 | #35 | Exceptional 5.3% |
| Immigrants | Czechoslovakia | 99.7 /100 | #36 | Exceptional 5.3% |
Demographics Similar to Immigrants from Cabo Verde by Single Mother Households
In terms of single mother households, the demographic groups most similar to Immigrants from Cabo Verde are Yuman (9.6%, a difference of 0.59%), Immigrants from Dominican Republic (9.5%, a difference of 0.78%), Dominican (9.2%, a difference of 4.3%), Yup'ik (10.0%, a difference of 4.4%), and Menominee (9.2%, a difference of 4.5%).
| Demographics | Rating | Rank | Single Mother Households |
| Liberians | 0.0 /100 | #333 | Tragic 8.6% |
| Immigrants | Liberia | 0.0 /100 | #334 | Tragic 8.7% |
| Immigrants | Dominica | 0.0 /100 | #335 | Tragic 8.7% |
| Puerto Ricans | 0.0 /100 | #336 | Tragic 8.7% |
| Navajo | 0.0 /100 | #337 | Tragic 8.8% |
| Cape Verdeans | 0.0 /100 | #338 | Tragic 8.9% |
| Blacks/African Americans | 0.0 /100 | #339 | Tragic 9.0% |
| Lumbee | 0.0 /100 | #340 | Tragic 9.1% |
| Tohono O'odham | 0.0 /100 | #341 | Tragic 9.1% |
| Menominee | 0.0 /100 | #342 | Tragic 9.2% |
| Dominicans | 0.0 /100 | #343 | Tragic 9.2% |
| Immigrants | Dominican Republic | 0.0 /100 | #344 | Tragic 9.5% |
| Immigrants | Cabo Verde | 0.0 /100 | #345 | Tragic 9.6% |
| Yuman | 0.0 /100 | #346 | Tragic 9.6% |
| Yup'ik | 0.0 /100 | #347 | Tragic 10.0% |