Samoan vs Immigrants from Cabo Verde 11th Grade
COMPARE
Samoan
Immigrants from Cabo Verde
11th Grade
11th Grade Comparison
Samoans
Immigrants from Cabo Verde
92.3%
11TH GRADE
25.1/ 100
METRIC RATING
200th/ 347
METRIC RANK
87.6%
11TH GRADE
0.0/ 100
METRIC RATING
327th/ 347
METRIC RANK
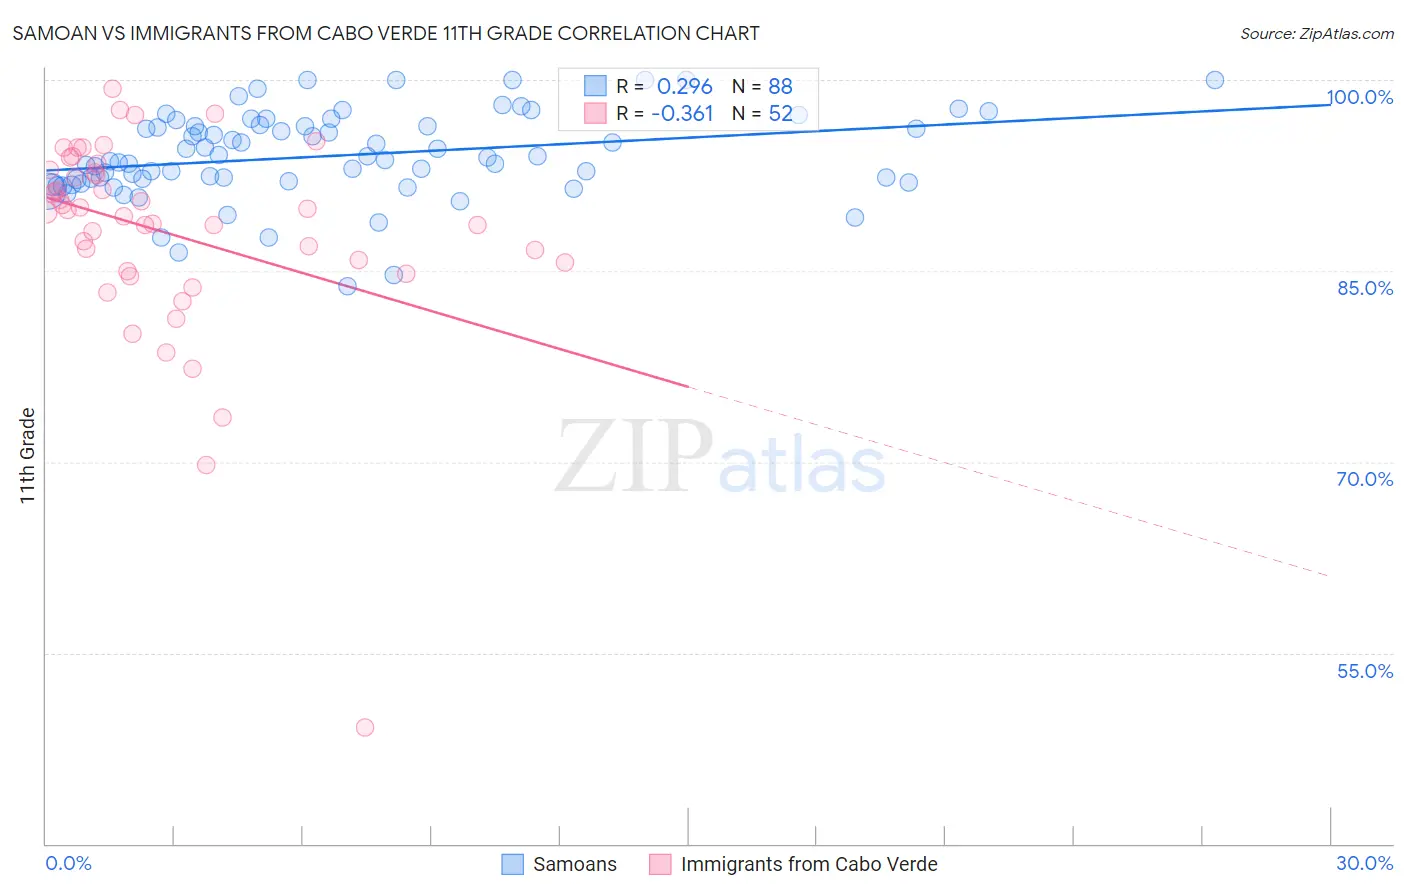
Samoan vs Immigrants from Cabo Verde 11th Grade Correlation Chart
The statistical analysis conducted on geographies consisting of 225,205,818 people shows a weak positive correlation between the proportion of Samoans and percentage of population with at least 11th grade education in the United States with a correlation coefficient (R) of 0.296 and weighted average of 92.3%. Similarly, the statistical analysis conducted on geographies consisting of 38,158,504 people shows a mild negative correlation between the proportion of Immigrants from Cabo Verde and percentage of population with at least 11th grade education in the United States with a correlation coefficient (R) of -0.361 and weighted average of 87.6%, a difference of 5.3%.
11th Grade Correlation Summary
| Measurement | Samoan | Immigrants from Cabo Verde |
| Minimum | 83.8% | 49.2% |
| Maximum | 100.0% | 99.3% |
| Range | 16.2% | 50.1% |
| Mean | 94.0% | 88.0% |
| Median | 93.8% | 89.7% |
| Interquartile 25% (IQ1) | 92.0% | 85.3% |
| Interquartile 75% (IQ3) | 96.4% | 92.8% |
| Interquartile Range (IQR) | 4.4% | 7.5% |
| Standard Deviation (Sample) | 3.4% | 8.1% |
| Standard Deviation (Population) | 3.4% | 8.0% |
Similar Demographics by 11th Grade
Demographics Similar to Samoans by 11th Grade
In terms of 11th grade, the demographic groups most similar to Samoans are Immigrants from Uganda (92.3%, a difference of 0.0%), Immigrants from China (92.3%, a difference of 0.0%), Marshallese (92.3%, a difference of 0.010%), Hawaiian (92.3%, a difference of 0.010%), and Immigrants from Eastern Africa (92.3%, a difference of 0.010%).
| Demographics | Rating | Rank | 11th Grade |
| Moroccans | 28.7 /100 | #193 | Fair 92.3% |
| Sioux | 28.5 /100 | #194 | Fair 92.3% |
| Liberians | 26.8 /100 | #195 | Fair 92.3% |
| Panamanians | 26.4 /100 | #196 | Fair 92.3% |
| Marshallese | 26.0 /100 | #197 | Fair 92.3% |
| Hawaiians | 25.5 /100 | #198 | Fair 92.3% |
| Immigrants | Uganda | 25.2 /100 | #199 | Fair 92.3% |
| Samoans | 25.1 /100 | #200 | Fair 92.3% |
| Immigrants | China | 25.1 /100 | #201 | Fair 92.3% |
| Immigrants | Eastern Africa | 24.1 /100 | #202 | Fair 92.3% |
| Immigrants | Sudan | 23.5 /100 | #203 | Fair 92.3% |
| Immigrants | Hong Kong | 23.3 /100 | #204 | Fair 92.2% |
| Kiowa | 23.2 /100 | #205 | Fair 92.2% |
| Bolivians | 23.2 /100 | #206 | Fair 92.2% |
| Immigrants | Oceania | 22.4 /100 | #207 | Fair 92.2% |
Demographics Similar to Immigrants from Cabo Verde by 11th Grade
In terms of 11th grade, the demographic groups most similar to Immigrants from Cabo Verde are Dominican (87.7%, a difference of 0.020%), Tohono O'odham (87.6%, a difference of 0.060%), Mexican American Indian (87.5%, a difference of 0.13%), Honduran (87.4%, a difference of 0.31%), and Hispanic or Latino (87.3%, a difference of 0.38%).
| Demographics | Rating | Rank | 11th Grade |
| Immigrants | Armenia | 0.0 /100 | #320 | Tragic 88.8% |
| Immigrants | Belize | 0.0 /100 | #321 | Tragic 88.7% |
| Puerto Ricans | 0.0 /100 | #322 | Tragic 88.4% |
| Pima | 0.0 /100 | #323 | Tragic 88.3% |
| Central American Indians | 0.0 /100 | #324 | Tragic 88.2% |
| Immigrants | Nicaragua | 0.0 /100 | #325 | Tragic 88.1% |
| Dominicans | 0.0 /100 | #326 | Tragic 87.7% |
| Immigrants | Cabo Verde | 0.0 /100 | #327 | Tragic 87.6% |
| Tohono O'odham | 0.0 /100 | #328 | Tragic 87.6% |
| Mexican American Indians | 0.0 /100 | #329 | Tragic 87.5% |
| Hondurans | 0.0 /100 | #330 | Tragic 87.4% |
| Hispanics or Latinos | 0.0 /100 | #331 | Tragic 87.3% |
| Immigrants | Azores | 0.0 /100 | #332 | Tragic 87.2% |
| Immigrants | Yemen | 0.0 /100 | #333 | Tragic 87.1% |
| Houma | 0.0 /100 | #334 | Tragic 87.0% |