Immigrants from Ghana vs Immigrants from Cabo Verde Single Mother Households
COMPARE
Immigrants from Ghana
Immigrants from Cabo Verde
Single Mother Households
Single Mother Households Comparison
Immigrants from Ghana
Immigrants from Cabo Verde
8.0%
SINGLE MOTHER HOUSEHOLDS
0.0/ 100
METRIC RATING
302nd/ 347
METRIC RANK
9.6%
SINGLE MOTHER HOUSEHOLDS
0.0/ 100
METRIC RATING
345th/ 347
METRIC RANK
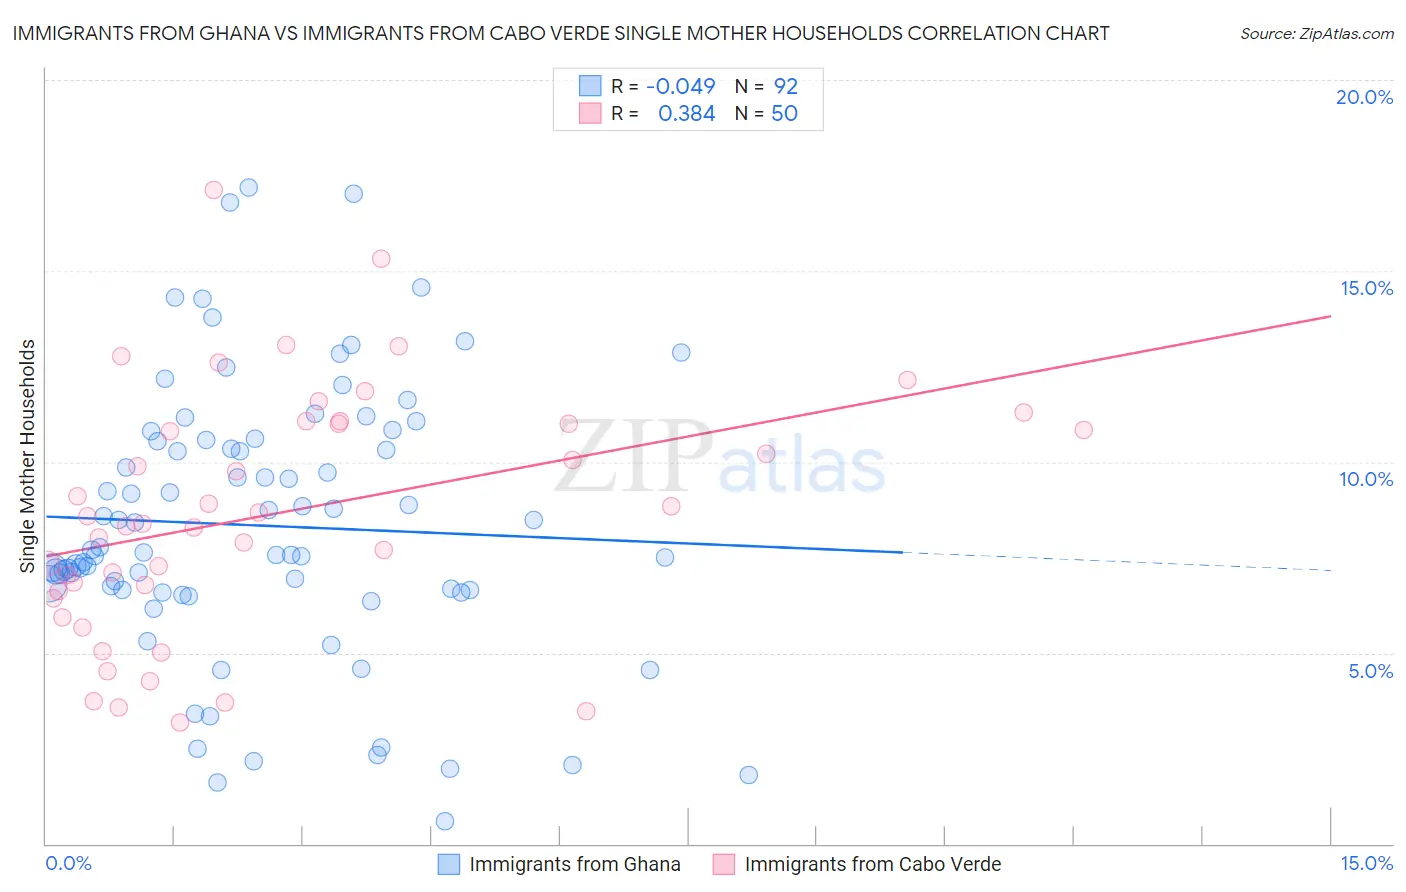
Immigrants from Ghana vs Immigrants from Cabo Verde Single Mother Households Correlation Chart
The statistical analysis conducted on geographies consisting of 199,625,094 people shows no correlation between the proportion of Immigrants from Ghana and percentage of single mother households in the United States with a correlation coefficient (R) of -0.049 and weighted average of 8.0%. Similarly, the statistical analysis conducted on geographies consisting of 38,117,400 people shows a mild positive correlation between the proportion of Immigrants from Cabo Verde and percentage of single mother households in the United States with a correlation coefficient (R) of 0.384 and weighted average of 9.6%, a difference of 20.0%.
Single Mother Households Correlation Summary
| Measurement | Immigrants from Ghana | Immigrants from Cabo Verde |
| Minimum | 0.60% | 3.2% |
| Maximum | 17.2% | 17.1% |
| Range | 16.6% | 13.9% |
| Mean | 8.3% | 8.7% |
| Median | 7.7% | 8.5% |
| Interquartile 25% (IQ1) | 6.6% | 6.6% |
| Interquartile 75% (IQ3) | 10.6% | 11.0% |
| Interquartile Range (IQR) | 3.9% | 4.4% |
| Standard Deviation (Sample) | 3.5% | 3.2% |
| Standard Deviation (Population) | 3.5% | 3.2% |
Similar Demographics by Single Mother Households
Demographics Similar to Immigrants from Ghana by Single Mother Households
In terms of single mother households, the demographic groups most similar to Immigrants from Ghana are Immigrants from Bahamas (8.0%, a difference of 0.020%), Chippewa (8.0%, a difference of 0.10%), Mexican (8.0%, a difference of 0.25%), Native/Alaskan (8.0%, a difference of 0.46%), and Colville (8.0%, a difference of 0.51%).
| Demographics | Rating | Rank | Single Mother Households |
| Barbadians | 0.0 /100 | #295 | Tragic 7.9% |
| Immigrants | Latin America | 0.0 /100 | #296 | Tragic 7.9% |
| Hispanics or Latinos | 0.0 /100 | #297 | Tragic 7.9% |
| Immigrants | West Indies | 0.0 /100 | #298 | Tragic 7.9% |
| Houma | 0.0 /100 | #299 | Tragic 7.9% |
| Mexicans | 0.0 /100 | #300 | Tragic 8.0% |
| Chippewa | 0.0 /100 | #301 | Tragic 8.0% |
| Immigrants | Ghana | 0.0 /100 | #302 | Tragic 8.0% |
| Immigrants | Bahamas | 0.0 /100 | #303 | Tragic 8.0% |
| Natives/Alaskans | 0.0 /100 | #304 | Tragic 8.0% |
| Colville | 0.0 /100 | #305 | Tragic 8.0% |
| Immigrants | Barbados | 0.0 /100 | #306 | Tragic 8.0% |
| Immigrants | St. Vincent and the Grenadines | 0.0 /100 | #307 | Tragic 8.0% |
| Immigrants | Central America | 0.0 /100 | #308 | Tragic 8.1% |
| Cheyenne | 0.0 /100 | #309 | Tragic 8.1% |
Demographics Similar to Immigrants from Cabo Verde by Single Mother Households
In terms of single mother households, the demographic groups most similar to Immigrants from Cabo Verde are Yuman (9.6%, a difference of 0.59%), Immigrants from Dominican Republic (9.5%, a difference of 0.78%), Dominican (9.2%, a difference of 4.3%), Yup'ik (10.0%, a difference of 4.4%), and Menominee (9.2%, a difference of 4.5%).
| Demographics | Rating | Rank | Single Mother Households |
| Liberians | 0.0 /100 | #333 | Tragic 8.6% |
| Immigrants | Liberia | 0.0 /100 | #334 | Tragic 8.7% |
| Immigrants | Dominica | 0.0 /100 | #335 | Tragic 8.7% |
| Puerto Ricans | 0.0 /100 | #336 | Tragic 8.7% |
| Navajo | 0.0 /100 | #337 | Tragic 8.8% |
| Cape Verdeans | 0.0 /100 | #338 | Tragic 8.9% |
| Blacks/African Americans | 0.0 /100 | #339 | Tragic 9.0% |
| Lumbee | 0.0 /100 | #340 | Tragic 9.1% |
| Tohono O'odham | 0.0 /100 | #341 | Tragic 9.1% |
| Menominee | 0.0 /100 | #342 | Tragic 9.2% |
| Dominicans | 0.0 /100 | #343 | Tragic 9.2% |
| Immigrants | Dominican Republic | 0.0 /100 | #344 | Tragic 9.5% |
| Immigrants | Cabo Verde | 0.0 /100 | #345 | Tragic 9.6% |
| Yuman | 0.0 /100 | #346 | Tragic 9.6% |
| Yup'ik | 0.0 /100 | #347 | Tragic 10.0% |