Vietnamese vs Immigrants from Cabo Verde Single Mother Households
COMPARE
Vietnamese
Immigrants from Cabo Verde
Single Mother Households
Single Mother Households Comparison
Vietnamese
Immigrants from Cabo Verde
6.7%
SINGLE MOTHER HOUSEHOLDS
11.3/ 100
METRIC RATING
208th/ 347
METRIC RANK
9.6%
SINGLE MOTHER HOUSEHOLDS
0.0/ 100
METRIC RATING
345th/ 347
METRIC RANK
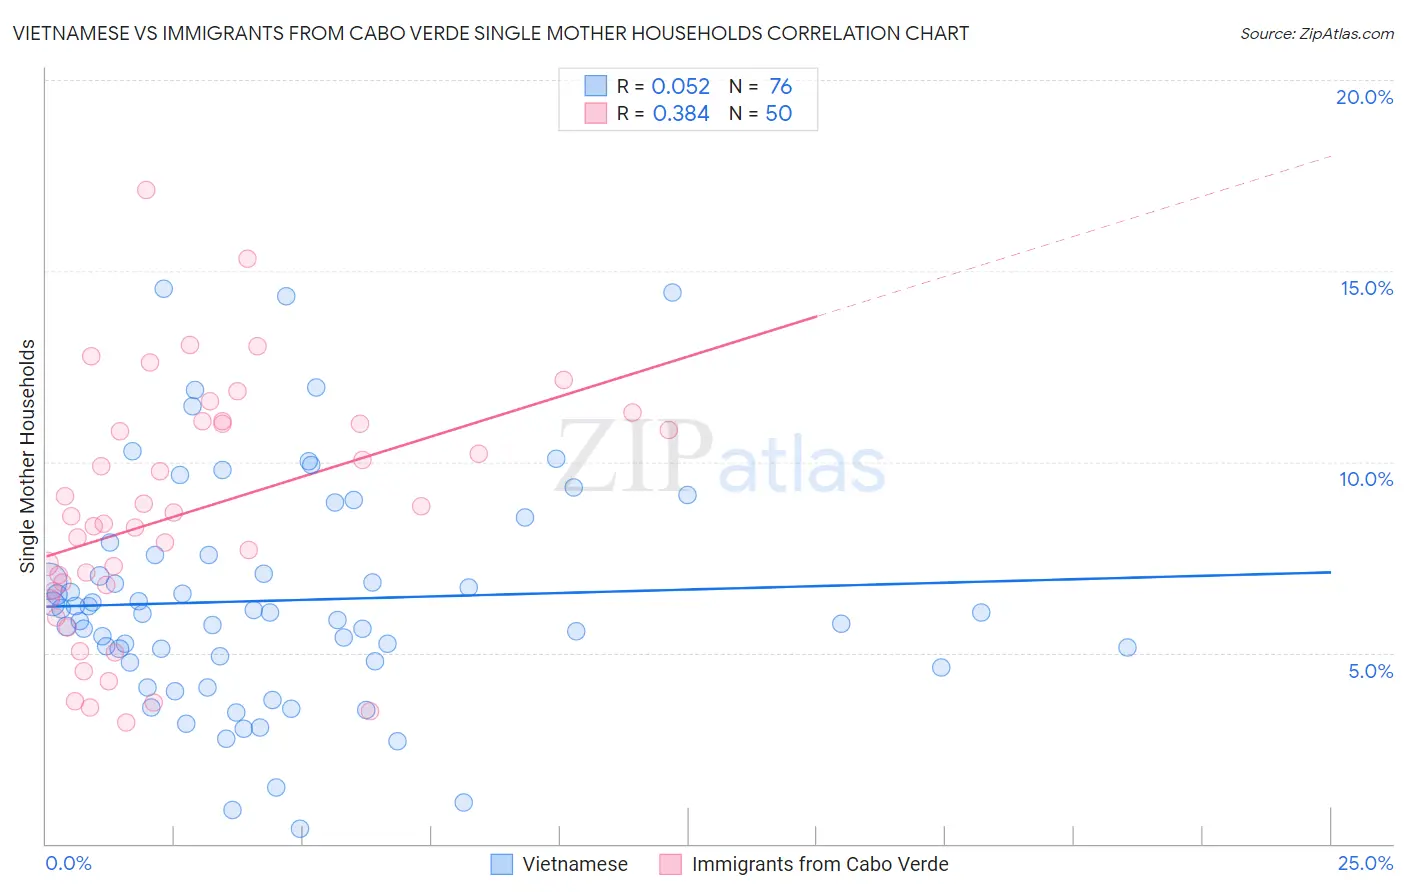
Vietnamese vs Immigrants from Cabo Verde Single Mother Households Correlation Chart
The statistical analysis conducted on geographies consisting of 170,499,454 people shows a slight positive correlation between the proportion of Vietnamese and percentage of single mother households in the United States with a correlation coefficient (R) of 0.052 and weighted average of 6.7%. Similarly, the statistical analysis conducted on geographies consisting of 38,117,400 people shows a mild positive correlation between the proportion of Immigrants from Cabo Verde and percentage of single mother households in the United States with a correlation coefficient (R) of 0.384 and weighted average of 9.6%, a difference of 43.7%.
Single Mother Households Correlation Summary
| Measurement | Vietnamese | Immigrants from Cabo Verde |
| Minimum | 0.40% | 3.2% |
| Maximum | 14.5% | 17.1% |
| Range | 14.1% | 13.9% |
| Mean | 6.4% | 8.7% |
| Median | 6.0% | 8.5% |
| Interquartile 25% (IQ1) | 4.8% | 6.6% |
| Interquartile 75% (IQ3) | 7.6% | 11.0% |
| Interquartile Range (IQR) | 2.8% | 4.4% |
| Standard Deviation (Sample) | 3.0% | 3.2% |
| Standard Deviation (Population) | 2.9% | 3.2% |
Similar Demographics by Single Mother Households
Demographics Similar to Vietnamese by Single Mother Households
In terms of single mother households, the demographic groups most similar to Vietnamese are German Russian (6.7%, a difference of 0.050%), Immigrants from South America (6.7%, a difference of 0.050%), Cree (6.7%, a difference of 0.14%), Immigrants from Fiji (6.7%, a difference of 0.15%), and Immigrants from Peru (6.7%, a difference of 0.17%).
| Demographics | Rating | Rank | Single Mother Households |
| Venezuelans | 12.9 /100 | #201 | Poor 6.6% |
| Guamanians/Chamorros | 12.4 /100 | #202 | Poor 6.6% |
| Immigrants | Peru | 12.0 /100 | #203 | Poor 6.7% |
| Immigrants | Fiji | 11.9 /100 | #204 | Poor 6.7% |
| Cree | 11.9 /100 | #205 | Poor 6.7% |
| German Russians | 11.5 /100 | #206 | Poor 6.7% |
| Immigrants | South America | 11.5 /100 | #207 | Poor 6.7% |
| Vietnamese | 11.3 /100 | #208 | Poor 6.7% |
| Immigrants | Colombia | 10.5 /100 | #209 | Poor 6.7% |
| Immigrants | Nonimmigrants | 10.4 /100 | #210 | Poor 6.7% |
| Immigrants | Venezuela | 8.5 /100 | #211 | Tragic 6.7% |
| Immigrants | Eritrea | 8.4 /100 | #212 | Tragic 6.7% |
| Immigrants | Costa Rica | 8.2 /100 | #213 | Tragic 6.7% |
| Immigrants | Uruguay | 7.9 /100 | #214 | Tragic 6.7% |
| Shoshone | 5.7 /100 | #215 | Tragic 6.8% |
Demographics Similar to Immigrants from Cabo Verde by Single Mother Households
In terms of single mother households, the demographic groups most similar to Immigrants from Cabo Verde are Yuman (9.6%, a difference of 0.59%), Immigrants from Dominican Republic (9.5%, a difference of 0.78%), Dominican (9.2%, a difference of 4.3%), Yup'ik (10.0%, a difference of 4.4%), and Menominee (9.2%, a difference of 4.5%).
| Demographics | Rating | Rank | Single Mother Households |
| Liberians | 0.0 /100 | #333 | Tragic 8.6% |
| Immigrants | Liberia | 0.0 /100 | #334 | Tragic 8.7% |
| Immigrants | Dominica | 0.0 /100 | #335 | Tragic 8.7% |
| Puerto Ricans | 0.0 /100 | #336 | Tragic 8.7% |
| Navajo | 0.0 /100 | #337 | Tragic 8.8% |
| Cape Verdeans | 0.0 /100 | #338 | Tragic 8.9% |
| Blacks/African Americans | 0.0 /100 | #339 | Tragic 9.0% |
| Lumbee | 0.0 /100 | #340 | Tragic 9.1% |
| Tohono O'odham | 0.0 /100 | #341 | Tragic 9.1% |
| Menominee | 0.0 /100 | #342 | Tragic 9.2% |
| Dominicans | 0.0 /100 | #343 | Tragic 9.2% |
| Immigrants | Dominican Republic | 0.0 /100 | #344 | Tragic 9.5% |
| Immigrants | Cabo Verde | 0.0 /100 | #345 | Tragic 9.6% |
| Yuman | 0.0 /100 | #346 | Tragic 9.6% |
| Yup'ik | 0.0 /100 | #347 | Tragic 10.0% |