Samoan vs Immigrants from Barbados Divorced or Separated
COMPARE
Samoan
Immigrants from Barbados
Divorced or Separated
Divorced or Separated Comparison
Samoans
Immigrants from Barbados
12.0%
DIVORCED OR SEPARATED
64.3/ 100
METRIC RATING
162nd/ 347
METRIC RANK
12.0%
DIVORCED OR SEPARATED
66.0/ 100
METRIC RATING
159th/ 347
METRIC RANK
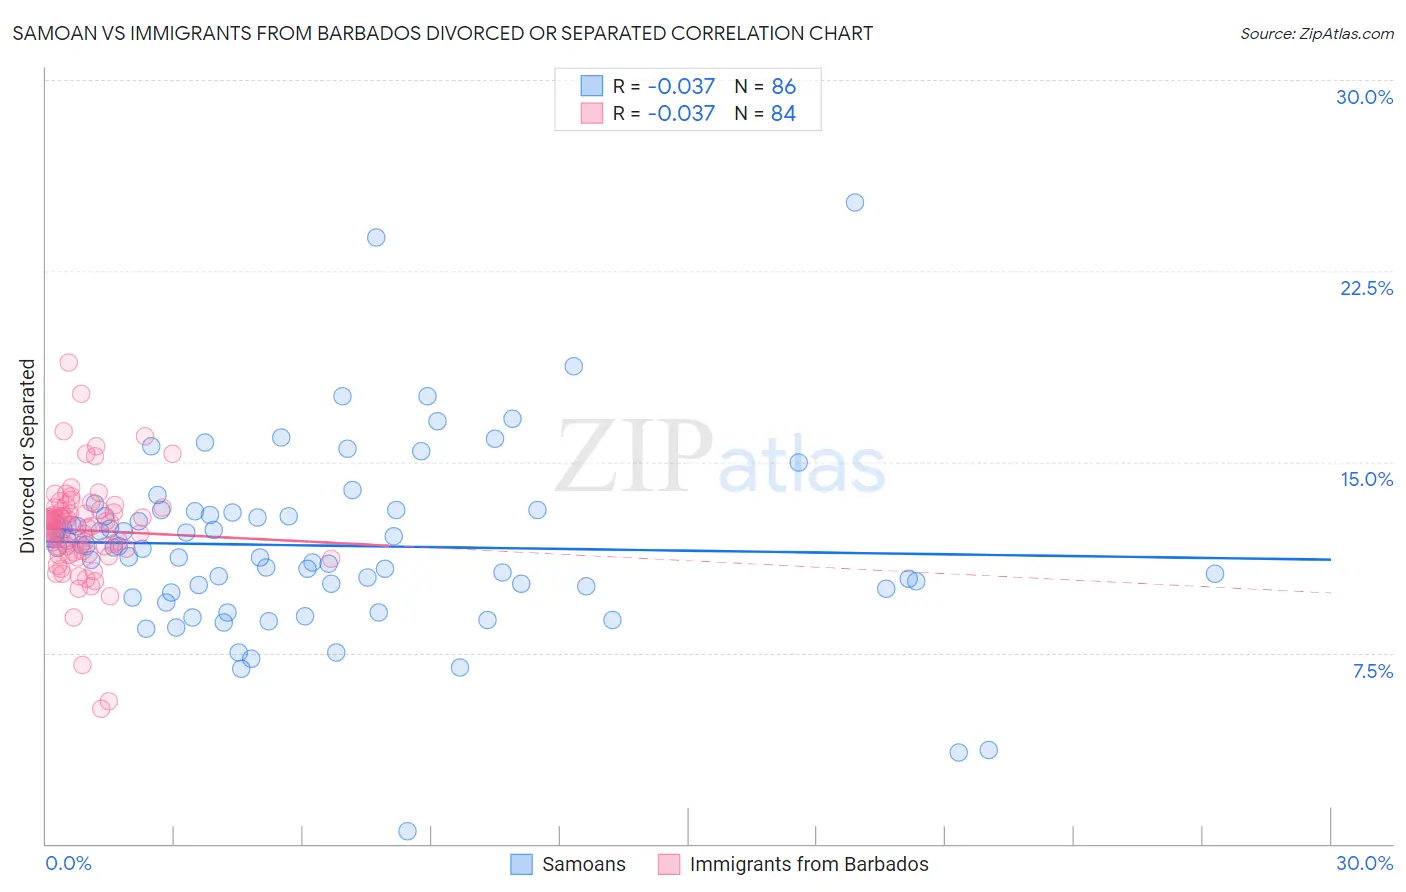
Samoan vs Immigrants from Barbados Divorced or Separated Correlation Chart
The statistical analysis conducted on geographies consisting of 225,171,159 people shows no correlation between the proportion of Samoans and percentage of population currently divorced or separated in the United States with a correlation coefficient (R) of -0.037 and weighted average of 12.0%. Similarly, the statistical analysis conducted on geographies consisting of 112,765,917 people shows no correlation between the proportion of Immigrants from Barbados and percentage of population currently divorced or separated in the United States with a correlation coefficient (R) of -0.037 and weighted average of 12.0%, a difference of 0.070%.
Divorced or Separated Correlation Summary
| Measurement | Samoan | Immigrants from Barbados |
| Minimum | 0.50% | 5.3% |
| Maximum | 25.2% | 18.9% |
| Range | 24.7% | 13.6% |
| Mean | 11.7% | 12.3% |
| Median | 11.7% | 12.4% |
| Interquartile 25% (IQ1) | 10.0% | 11.4% |
| Interquartile 75% (IQ3) | 13.0% | 13.1% |
| Interquartile Range (IQR) | 3.0% | 1.6% |
| Standard Deviation (Sample) | 3.6% | 2.0% |
| Standard Deviation (Population) | 3.6% | 2.0% |
Demographics Similar to Samoans and Immigrants from Barbados by Divorced or Separated
In terms of divorced or separated, the demographic groups most similar to Samoans are Marshallese (12.0%, a difference of 0.010%), Navajo (12.0%, a difference of 0.010%), Swiss (12.0%, a difference of 0.020%), Immigrants from Scotland (12.0%, a difference of 0.060%), and Icelander (12.0%, a difference of 0.070%). Similarly, the demographic groups most similar to Immigrants from Barbados are Icelander (12.0%, a difference of 0.0%), Immigrants from Scotland (12.0%, a difference of 0.010%), Marshallese (12.0%, a difference of 0.050%), Navajo (12.0%, a difference of 0.080%), and Swiss (12.0%, a difference of 0.090%).
| Demographics | Rating | Rank | Divorced or Separated |
| Immigrants | Portugal | 77.3 /100 | #150 | Good 11.9% |
| Czechs | 76.4 /100 | #151 | Good 11.9% |
| Immigrants | Hungary | 73.7 /100 | #152 | Good 11.9% |
| Austrians | 72.2 /100 | #153 | Good 12.0% |
| Chileans | 71.3 /100 | #154 | Good 12.0% |
| Japanese | 70.9 /100 | #155 | Good 12.0% |
| Hungarians | 70.3 /100 | #156 | Good 12.0% |
| Immigrants | Brazil | 68.8 /100 | #157 | Good 12.0% |
| Icelanders | 66.0 /100 | #158 | Good 12.0% |
| Immigrants | Barbados | 66.0 /100 | #159 | Good 12.0% |
| Immigrants | Scotland | 65.8 /100 | #160 | Good 12.0% |
| Marshallese | 64.6 /100 | #161 | Good 12.0% |
| Samoans | 64.3 /100 | #162 | Good 12.0% |
| Navajo | 63.9 /100 | #163 | Good 12.0% |
| Swiss | 63.6 /100 | #164 | Good 12.0% |
| German Russians | 61.8 /100 | #165 | Good 12.0% |
| Tohono O'odham | 60.4 /100 | #166 | Good 12.0% |
| Ethiopians | 58.5 /100 | #167 | Average 12.0% |
| Serbians | 57.1 /100 | #168 | Average 12.0% |
| Immigrants | Peru | 57.0 /100 | #169 | Average 12.0% |
| Mexican American Indians | 55.8 /100 | #170 | Average 12.0% |