Samoan vs Canadian Average Family Size
COMPARE
Samoan
Canadian
Average Family Size
Average Family Size Comparison
Samoans
Canadians
3.42
AVERAGE FAMILY SIZE
100.0/ 100
METRIC RATING
30th/ 347
METRIC RANK
3.14
AVERAGE FAMILY SIZE
0.2/ 100
METRIC RATING
299th/ 347
METRIC RANK
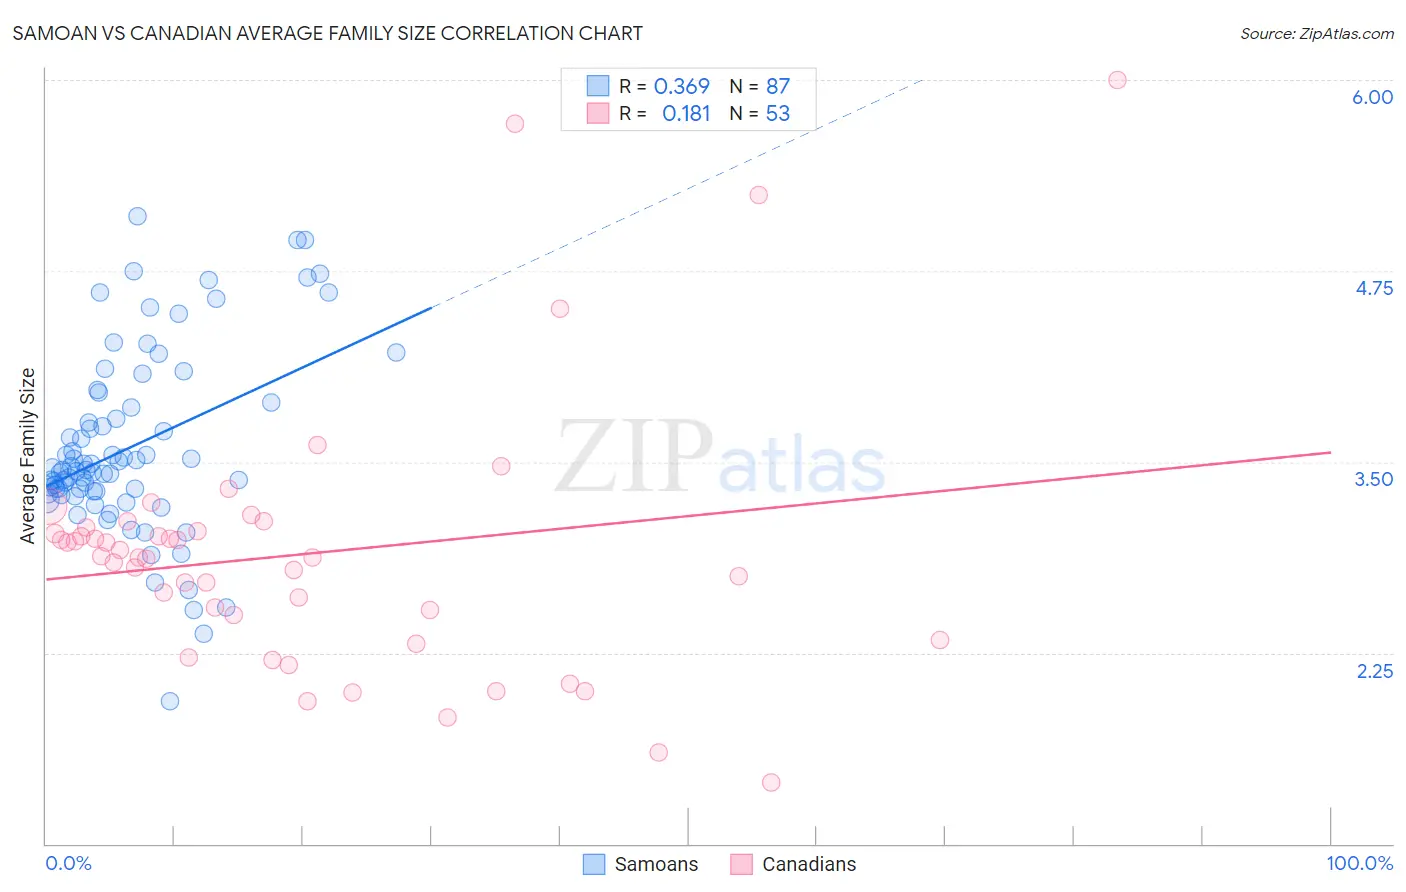
Samoan vs Canadian Average Family Size Correlation Chart
The statistical analysis conducted on geographies consisting of 225,071,591 people shows a mild positive correlation between the proportion of Samoans and average family size in the United States with a correlation coefficient (R) of 0.369 and weighted average of 3.42. Similarly, the statistical analysis conducted on geographies consisting of 437,289,019 people shows a poor positive correlation between the proportion of Canadians and average family size in the United States with a correlation coefficient (R) of 0.181 and weighted average of 3.14, a difference of 9.0%.
Average Family Size Correlation Summary
| Measurement | Samoan | Canadian |
| Minimum | 1.93 | 1.40 |
| Maximum | 5.11 | 6.00 |
| Range | 3.18 | 4.60 |
| Mean | 3.60 | 2.90 |
| Median | 3.45 | 2.87 |
| Interquartile 25% (IQ1) | 3.30 | 2.42 |
| Interquartile 75% (IQ3) | 3.89 | 3.06 |
| Interquartile Range (IQR) | 0.58 | 0.64 |
| Standard Deviation (Sample) | 0.60 | 0.87 |
| Standard Deviation (Population) | 0.60 | 0.86 |
Similar Demographics by Average Family Size
Demographics Similar to Samoans by Average Family Size
In terms of average family size, the demographic groups most similar to Samoans are Nepalese (3.42, a difference of 0.030%), Immigrants from Latin America (3.42, a difference of 0.12%), Central American (3.41, a difference of 0.20%), Mexican American Indian (3.43, a difference of 0.24%), and Native Hawaiian (3.43, a difference of 0.25%).
| Demographics | Rating | Rank | Average Family Size |
| Immigrants | Fiji | 100.0 /100 | #23 | Exceptional 3.45 |
| Natives/Alaskans | 100.0 /100 | #24 | Exceptional 3.45 |
| Yakama | 100.0 /100 | #25 | Exceptional 3.45 |
| Native Hawaiians | 100.0 /100 | #26 | Exceptional 3.43 |
| Mexican American Indians | 100.0 /100 | #27 | Exceptional 3.43 |
| Immigrants | Latin America | 100.0 /100 | #28 | Exceptional 3.42 |
| Nepalese | 100.0 /100 | #29 | Exceptional 3.42 |
| Samoans | 100.0 /100 | #30 | Exceptional 3.42 |
| Central Americans | 100.0 /100 | #31 | Exceptional 3.41 |
| Immigrants | Guatemala | 100.0 /100 | #32 | Exceptional 3.41 |
| Hawaiians | 100.0 /100 | #33 | Exceptional 3.41 |
| Hispanics or Latinos | 100.0 /100 | #34 | Exceptional 3.41 |
| Guatemalans | 100.0 /100 | #35 | Exceptional 3.40 |
| Immigrants | Guyana | 100.0 /100 | #36 | Exceptional 3.40 |
| Guyanese | 100.0 /100 | #37 | Exceptional 3.40 |
Demographics Similar to Canadians by Average Family Size
In terms of average family size, the demographic groups most similar to Canadians are Immigrants from Sweden (3.14, a difference of 0.010%), Austrian (3.14, a difference of 0.050%), Ukrainian (3.14, a difference of 0.050%), Immigrants from Western Europe (3.14, a difference of 0.050%), and Colville (3.14, a difference of 0.050%).
| Demographics | Rating | Rank | Average Family Size |
| Europeans | 0.2 /100 | #292 | Tragic 3.14 |
| Scandinavians | 0.2 /100 | #293 | Tragic 3.14 |
| Immigrants | Croatia | 0.2 /100 | #294 | Tragic 3.14 |
| Austrians | 0.2 /100 | #295 | Tragic 3.14 |
| Ukrainians | 0.2 /100 | #296 | Tragic 3.14 |
| Immigrants | Western Europe | 0.2 /100 | #297 | Tragic 3.14 |
| Colville | 0.2 /100 | #298 | Tragic 3.14 |
| Canadians | 0.2 /100 | #299 | Tragic 3.14 |
| Immigrants | Sweden | 0.2 /100 | #300 | Tragic 3.14 |
| Macedonians | 0.2 /100 | #301 | Tragic 3.13 |
| Immigrants | Latvia | 0.2 /100 | #302 | Tragic 3.13 |
| British | 0.2 /100 | #303 | Tragic 3.13 |
| Immigrants | Switzerland | 0.2 /100 | #304 | Tragic 3.13 |
| Australians | 0.1 /100 | #305 | Tragic 3.13 |
| Immigrants | Ireland | 0.1 /100 | #306 | Tragic 3.13 |