Nigerian vs Canadian Average Family Size
COMPARE
Nigerian
Canadian
Average Family Size
Average Family Size Comparison
Nigerians
Canadians
3.29
AVERAGE FAMILY SIZE
98.6/ 100
METRIC RATING
99th/ 347
METRIC RANK
3.14
AVERAGE FAMILY SIZE
0.2/ 100
METRIC RATING
299th/ 347
METRIC RANK
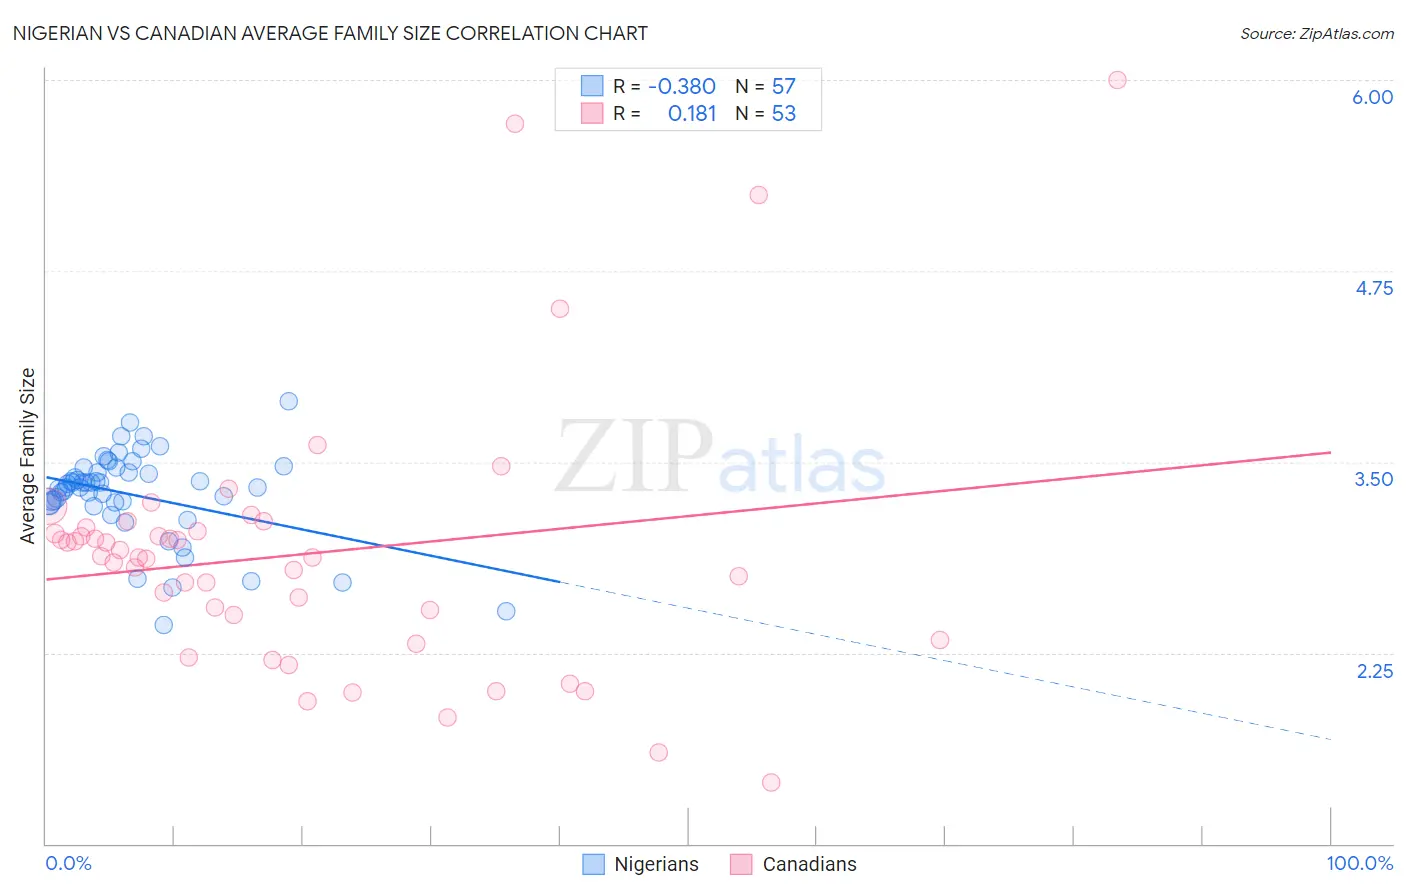
Nigerian vs Canadian Average Family Size Correlation Chart
The statistical analysis conducted on geographies consisting of 332,464,526 people shows a mild negative correlation between the proportion of Nigerians and average family size in the United States with a correlation coefficient (R) of -0.380 and weighted average of 3.29. Similarly, the statistical analysis conducted on geographies consisting of 437,289,019 people shows a poor positive correlation between the proportion of Canadians and average family size in the United States with a correlation coefficient (R) of 0.181 and weighted average of 3.14, a difference of 4.9%.
Average Family Size Correlation Summary
| Measurement | Nigerian | Canadian |
| Minimum | 2.43 | 1.40 |
| Maximum | 3.90 | 6.00 |
| Range | 1.47 | 4.60 |
| Mean | 3.28 | 2.90 |
| Median | 3.34 | 2.87 |
| Interquartile 25% (IQ1) | 3.23 | 2.42 |
| Interquartile 75% (IQ3) | 3.45 | 3.06 |
| Interquartile Range (IQR) | 0.22 | 0.64 |
| Standard Deviation (Sample) | 0.29 | 0.87 |
| Standard Deviation (Population) | 0.29 | 0.86 |
Similar Demographics by Average Family Size
Demographics Similar to Nigerians by Average Family Size
In terms of average family size, the demographic groups most similar to Nigerians are Barbadian (3.29, a difference of 0.0%), Immigrants from Oceania (3.29, a difference of 0.010%), Guamanian/Chamorro (3.29, a difference of 0.010%), Immigrants from Burma/Myanmar (3.29, a difference of 0.020%), and West Indian (3.29, a difference of 0.030%).
| Demographics | Rating | Rank | Average Family Size |
| Immigrants | Cameroon | 99.2 /100 | #92 | Exceptional 3.30 |
| Peruvians | 99.2 /100 | #93 | Exceptional 3.30 |
| Sierra Leoneans | 99.0 /100 | #94 | Exceptional 3.30 |
| Immigrants | Lebanon | 99.0 /100 | #95 | Exceptional 3.30 |
| U.S. Virgin Islanders | 98.8 /100 | #96 | Exceptional 3.29 |
| Immigrants | Oceania | 98.7 /100 | #97 | Exceptional 3.29 |
| Barbadians | 98.6 /100 | #98 | Exceptional 3.29 |
| Nigerians | 98.6 /100 | #99 | Exceptional 3.29 |
| Guamanians/Chamorros | 98.6 /100 | #100 | Exceptional 3.29 |
| Immigrants | Burma/Myanmar | 98.6 /100 | #101 | Exceptional 3.29 |
| West Indians | 98.5 /100 | #102 | Exceptional 3.29 |
| Immigrants | Western Africa | 98.4 /100 | #103 | Exceptional 3.29 |
| Bolivians | 98.3 /100 | #104 | Exceptional 3.29 |
| Immigrants | Ghana | 98.1 /100 | #105 | Exceptional 3.29 |
| Paiute | 98.0 /100 | #106 | Exceptional 3.29 |
Demographics Similar to Canadians by Average Family Size
In terms of average family size, the demographic groups most similar to Canadians are Immigrants from Sweden (3.14, a difference of 0.010%), Austrian (3.14, a difference of 0.050%), Ukrainian (3.14, a difference of 0.050%), Immigrants from Western Europe (3.14, a difference of 0.050%), and Colville (3.14, a difference of 0.050%).
| Demographics | Rating | Rank | Average Family Size |
| Europeans | 0.2 /100 | #292 | Tragic 3.14 |
| Scandinavians | 0.2 /100 | #293 | Tragic 3.14 |
| Immigrants | Croatia | 0.2 /100 | #294 | Tragic 3.14 |
| Austrians | 0.2 /100 | #295 | Tragic 3.14 |
| Ukrainians | 0.2 /100 | #296 | Tragic 3.14 |
| Immigrants | Western Europe | 0.2 /100 | #297 | Tragic 3.14 |
| Colville | 0.2 /100 | #298 | Tragic 3.14 |
| Canadians | 0.2 /100 | #299 | Tragic 3.14 |
| Immigrants | Sweden | 0.2 /100 | #300 | Tragic 3.14 |
| Macedonians | 0.2 /100 | #301 | Tragic 3.13 |
| Immigrants | Latvia | 0.2 /100 | #302 | Tragic 3.13 |
| British | 0.2 /100 | #303 | Tragic 3.13 |
| Immigrants | Switzerland | 0.2 /100 | #304 | Tragic 3.13 |
| Australians | 0.1 /100 | #305 | Tragic 3.13 |
| Immigrants | Ireland | 0.1 /100 | #306 | Tragic 3.13 |