Samoan vs West Indian Average Family Size
COMPARE
Samoan
West Indian
Average Family Size
Average Family Size Comparison
Samoans
West Indians
3.42
AVERAGE FAMILY SIZE
100.0/ 100
METRIC RATING
30th/ 347
METRIC RANK
3.29
AVERAGE FAMILY SIZE
98.5/ 100
METRIC RATING
102nd/ 347
METRIC RANK
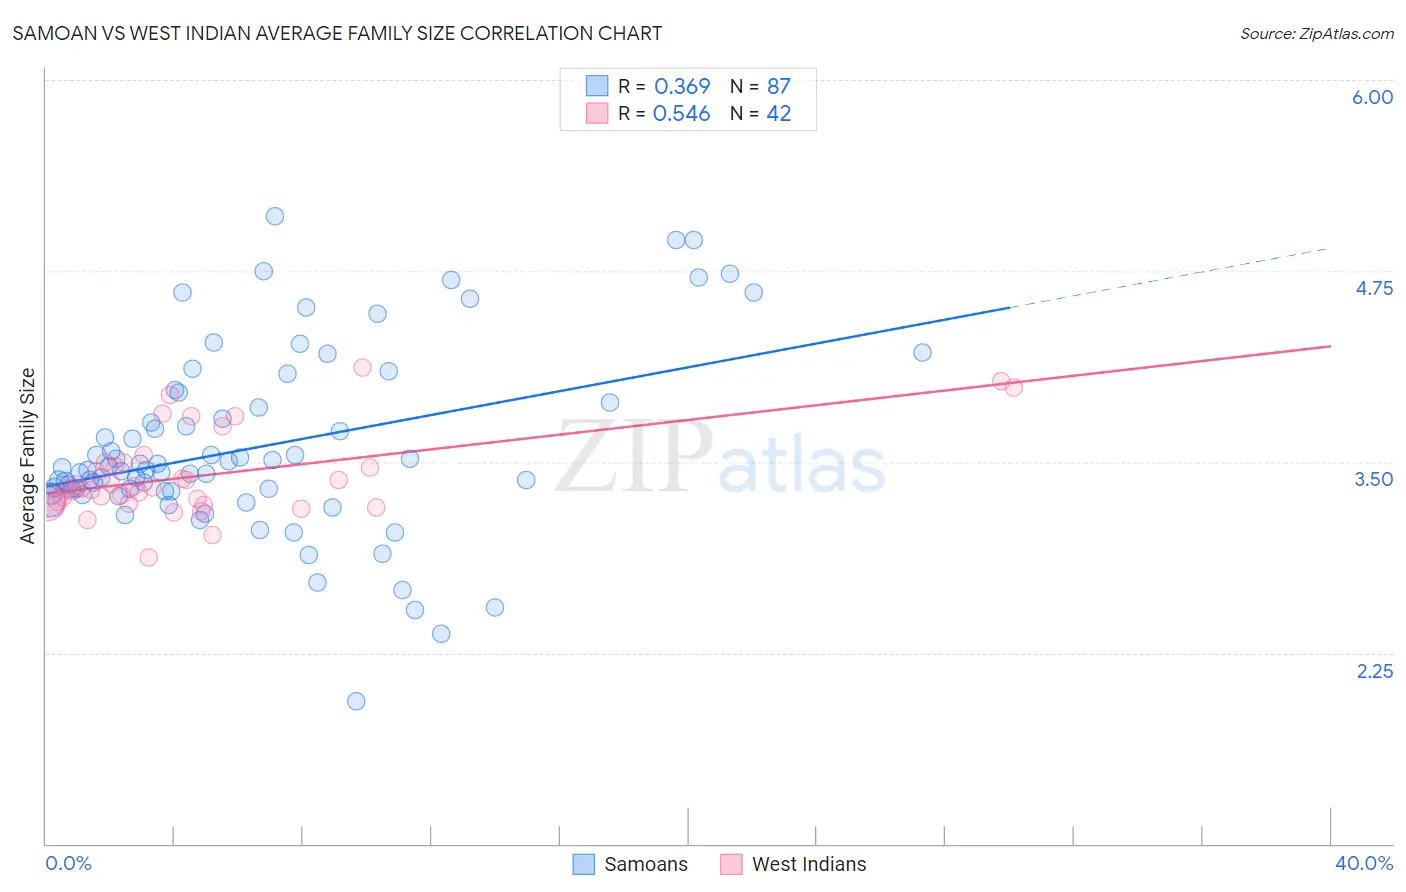
Samoan vs West Indian Average Family Size Correlation Chart
The statistical analysis conducted on geographies consisting of 225,071,591 people shows a mild positive correlation between the proportion of Samoans and average family size in the United States with a correlation coefficient (R) of 0.369 and weighted average of 3.42. Similarly, the statistical analysis conducted on geographies consisting of 253,859,351 people shows a substantial positive correlation between the proportion of West Indians and average family size in the United States with a correlation coefficient (R) of 0.546 and weighted average of 3.29, a difference of 3.9%.
Average Family Size Correlation Summary
| Measurement | Samoan | West Indian |
| Minimum | 1.93 | 2.87 |
| Maximum | 5.11 | 4.12 |
| Range | 3.18 | 1.25 |
| Mean | 3.60 | 3.41 |
| Median | 3.45 | 3.33 |
| Interquartile 25% (IQ1) | 3.30 | 3.23 |
| Interquartile 75% (IQ3) | 3.89 | 3.50 |
| Interquartile Range (IQR) | 0.58 | 0.26 |
| Standard Deviation (Sample) | 0.60 | 0.28 |
| Standard Deviation (Population) | 0.60 | 0.27 |
Similar Demographics by Average Family Size
Demographics Similar to Samoans by Average Family Size
In terms of average family size, the demographic groups most similar to Samoans are Nepalese (3.42, a difference of 0.030%), Immigrants from Latin America (3.42, a difference of 0.12%), Central American (3.41, a difference of 0.20%), Mexican American Indian (3.43, a difference of 0.24%), and Native Hawaiian (3.43, a difference of 0.25%).
| Demographics | Rating | Rank | Average Family Size |
| Immigrants | Fiji | 100.0 /100 | #23 | Exceptional 3.45 |
| Natives/Alaskans | 100.0 /100 | #24 | Exceptional 3.45 |
| Yakama | 100.0 /100 | #25 | Exceptional 3.45 |
| Native Hawaiians | 100.0 /100 | #26 | Exceptional 3.43 |
| Mexican American Indians | 100.0 /100 | #27 | Exceptional 3.43 |
| Immigrants | Latin America | 100.0 /100 | #28 | Exceptional 3.42 |
| Nepalese | 100.0 /100 | #29 | Exceptional 3.42 |
| Samoans | 100.0 /100 | #30 | Exceptional 3.42 |
| Central Americans | 100.0 /100 | #31 | Exceptional 3.41 |
| Immigrants | Guatemala | 100.0 /100 | #32 | Exceptional 3.41 |
| Hawaiians | 100.0 /100 | #33 | Exceptional 3.41 |
| Hispanics or Latinos | 100.0 /100 | #34 | Exceptional 3.41 |
| Guatemalans | 100.0 /100 | #35 | Exceptional 3.40 |
| Immigrants | Guyana | 100.0 /100 | #36 | Exceptional 3.40 |
| Guyanese | 100.0 /100 | #37 | Exceptional 3.40 |
Demographics Similar to West Indians by Average Family Size
In terms of average family size, the demographic groups most similar to West Indians are Immigrants from Burma/Myanmar (3.29, a difference of 0.010%), Guamanian/Chamorro (3.29, a difference of 0.020%), Barbadian (3.29, a difference of 0.030%), Nigerian (3.29, a difference of 0.030%), and Immigrants from Western Africa (3.29, a difference of 0.030%).
| Demographics | Rating | Rank | Average Family Size |
| Immigrants | Lebanon | 99.0 /100 | #95 | Exceptional 3.30 |
| U.S. Virgin Islanders | 98.8 /100 | #96 | Exceptional 3.29 |
| Immigrants | Oceania | 98.7 /100 | #97 | Exceptional 3.29 |
| Barbadians | 98.6 /100 | #98 | Exceptional 3.29 |
| Nigerians | 98.6 /100 | #99 | Exceptional 3.29 |
| Guamanians/Chamorros | 98.6 /100 | #100 | Exceptional 3.29 |
| Immigrants | Burma/Myanmar | 98.6 /100 | #101 | Exceptional 3.29 |
| West Indians | 98.5 /100 | #102 | Exceptional 3.29 |
| Immigrants | Western Africa | 98.4 /100 | #103 | Exceptional 3.29 |
| Bolivians | 98.3 /100 | #104 | Exceptional 3.29 |
| Immigrants | Ghana | 98.1 /100 | #105 | Exceptional 3.29 |
| Paiute | 98.0 /100 | #106 | Exceptional 3.29 |
| Ghanaians | 98.0 /100 | #107 | Exceptional 3.29 |
| Asians | 97.0 /100 | #108 | Exceptional 3.28 |
| Puerto Ricans | 96.7 /100 | #109 | Exceptional 3.28 |