Samoan vs Immigrants from Nicaragua Average Family Size
COMPARE
Samoan
Immigrants from Nicaragua
Average Family Size
Average Family Size Comparison
Samoans
Immigrants from Nicaragua
3.42
AVERAGE FAMILY SIZE
100.0/ 100
METRIC RATING
30th/ 347
METRIC RANK
3.37
AVERAGE FAMILY SIZE
100.0/ 100
METRIC RATING
48th/ 347
METRIC RANK
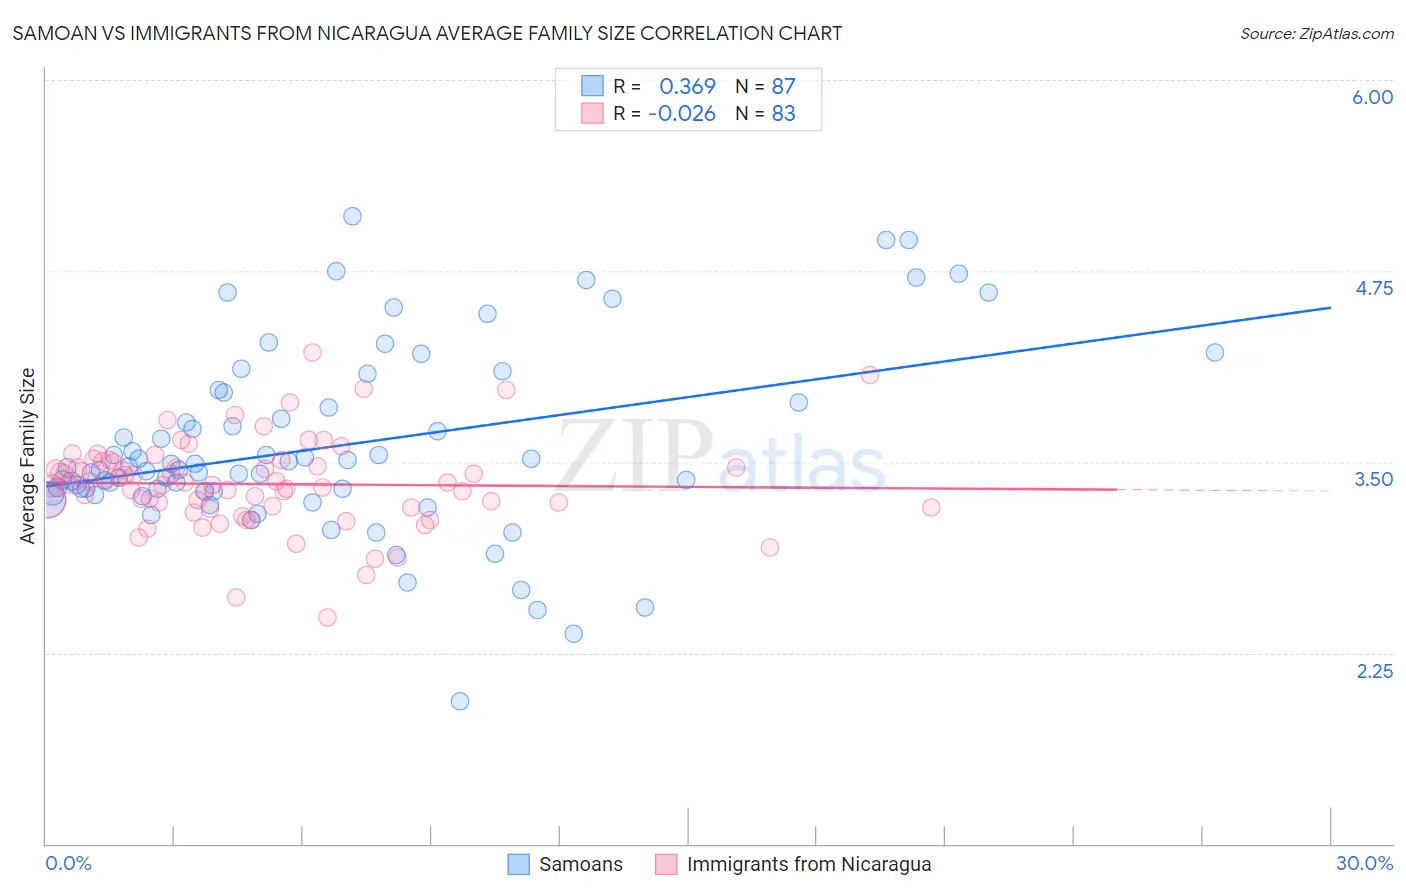
Samoan vs Immigrants from Nicaragua Average Family Size Correlation Chart
The statistical analysis conducted on geographies consisting of 225,071,591 people shows a mild positive correlation between the proportion of Samoans and average family size in the United States with a correlation coefficient (R) of 0.369 and weighted average of 3.42. Similarly, the statistical analysis conducted on geographies consisting of 236,326,320 people shows no correlation between the proportion of Immigrants from Nicaragua and average family size in the United States with a correlation coefficient (R) of -0.026 and weighted average of 3.37, a difference of 1.5%.
Average Family Size Correlation Summary
| Measurement | Samoan | Immigrants from Nicaragua |
| Minimum | 1.93 | 2.48 |
| Maximum | 5.11 | 4.22 |
| Range | 3.18 | 1.74 |
| Mean | 3.60 | 3.36 |
| Median | 3.45 | 3.35 |
| Interquartile 25% (IQ1) | 3.30 | 3.20 |
| Interquartile 75% (IQ3) | 3.89 | 3.50 |
| Interquartile Range (IQR) | 0.58 | 0.30 |
| Standard Deviation (Sample) | 0.60 | 0.29 |
| Standard Deviation (Population) | 0.60 | 0.29 |
Demographics Similar to Samoans and Immigrants from Nicaragua by Average Family Size
In terms of average family size, the demographic groups most similar to Samoans are Nepalese (3.42, a difference of 0.030%), Central American (3.41, a difference of 0.20%), Immigrants from Guatemala (3.41, a difference of 0.30%), Hawaiian (3.41, a difference of 0.33%), and Hispanic or Latino (3.41, a difference of 0.38%). Similarly, the demographic groups most similar to Immigrants from Nicaragua are Vietnamese (3.37, a difference of 0.0%), Haitian (3.37, a difference of 0.040%), Bangladeshi (3.37, a difference of 0.060%), Shoshone (3.37, a difference of 0.10%), and Alaska Native (3.37, a difference of 0.14%).
| Demographics | Rating | Rank | Average Family Size |
| Nepalese | 100.0 /100 | #29 | Exceptional 3.42 |
| Samoans | 100.0 /100 | #30 | Exceptional 3.42 |
| Central Americans | 100.0 /100 | #31 | Exceptional 3.41 |
| Immigrants | Guatemala | 100.0 /100 | #32 | Exceptional 3.41 |
| Hawaiians | 100.0 /100 | #33 | Exceptional 3.41 |
| Hispanics or Latinos | 100.0 /100 | #34 | Exceptional 3.41 |
| Guatemalans | 100.0 /100 | #35 | Exceptional 3.40 |
| Immigrants | Guyana | 100.0 /100 | #36 | Exceptional 3.40 |
| Guyanese | 100.0 /100 | #37 | Exceptional 3.40 |
| Immigrants | Belize | 100.0 /100 | #38 | Exceptional 3.39 |
| Immigrants | Haiti | 100.0 /100 | #39 | Exceptional 3.39 |
| Belizeans | 100.0 /100 | #40 | Exceptional 3.39 |
| Marshallese | 100.0 /100 | #41 | Exceptional 3.38 |
| Immigrants | Vietnam | 100.0 /100 | #42 | Exceptional 3.38 |
| Immigrants | Philippines | 100.0 /100 | #43 | Exceptional 3.37 |
| Alaska Natives | 100.0 /100 | #44 | Exceptional 3.37 |
| Shoshone | 100.0 /100 | #45 | Exceptional 3.37 |
| Haitians | 100.0 /100 | #46 | Exceptional 3.37 |
| Vietnamese | 100.0 /100 | #47 | Exceptional 3.37 |
| Immigrants | Nicaragua | 100.0 /100 | #48 | Exceptional 3.37 |
| Bangladeshis | 100.0 /100 | #49 | Exceptional 3.37 |