Celtic vs Canadian Average Family Size
COMPARE
Celtic
Canadian
Average Family Size
Average Family Size Comparison
Celtics
Canadians
3.11
AVERAGE FAMILY SIZE
0.0/ 100
METRIC RATING
324th/ 347
METRIC RANK
3.14
AVERAGE FAMILY SIZE
0.2/ 100
METRIC RATING
299th/ 347
METRIC RANK
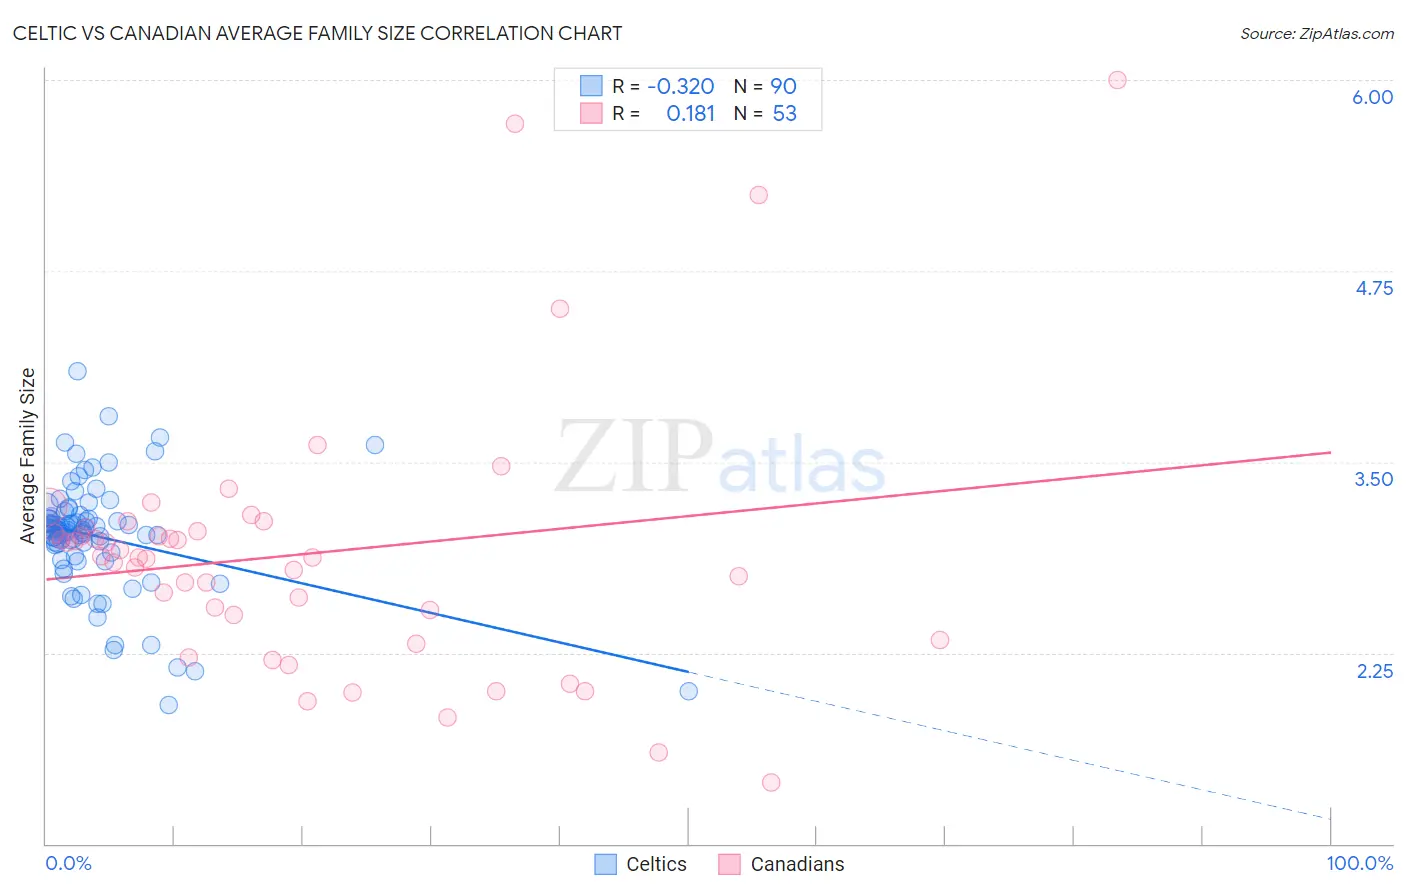
Celtic vs Canadian Average Family Size Correlation Chart
The statistical analysis conducted on geographies consisting of 168,846,519 people shows a mild negative correlation between the proportion of Celtics and average family size in the United States with a correlation coefficient (R) of -0.320 and weighted average of 3.11. Similarly, the statistical analysis conducted on geographies consisting of 437,289,019 people shows a poor positive correlation between the proportion of Canadians and average family size in the United States with a correlation coefficient (R) of 0.181 and weighted average of 3.14, a difference of 0.79%.
Average Family Size Correlation Summary
| Measurement | Celtic | Canadian |
| Minimum | 1.91 | 1.40 |
| Maximum | 4.09 | 6.00 |
| Range | 2.18 | 4.60 |
| Mean | 3.01 | 2.90 |
| Median | 3.05 | 2.87 |
| Interquartile 25% (IQ1) | 2.91 | 2.42 |
| Interquartile 75% (IQ3) | 3.15 | 3.06 |
| Interquartile Range (IQR) | 0.24 | 0.64 |
| Standard Deviation (Sample) | 0.37 | 0.87 |
| Standard Deviation (Population) | 0.37 | 0.86 |
Similar Demographics by Average Family Size
Demographics Similar to Celtics by Average Family Size
In terms of average family size, the demographic groups most similar to Celtics are English (3.11, a difference of 0.040%), Soviet Union (3.11, a difference of 0.080%), Ottawa (3.11, a difference of 0.090%), Dutch (3.11, a difference of 0.10%), and Czech (3.11, a difference of 0.10%).
| Demographics | Rating | Rank | Average Family Size |
| Italians | 0.1 /100 | #317 | Tragic 3.12 |
| Eastern Europeans | 0.1 /100 | #318 | Tragic 3.12 |
| Welsh | 0.1 /100 | #319 | Tragic 3.12 |
| Immigrants | North America | 0.0 /100 | #320 | Tragic 3.12 |
| Immigrants | Austria | 0.0 /100 | #321 | Tragic 3.12 |
| Immigrants | Canada | 0.0 /100 | #322 | Tragic 3.12 |
| Soviet Union | 0.0 /100 | #323 | Tragic 3.11 |
| Celtics | 0.0 /100 | #324 | Tragic 3.11 |
| English | 0.0 /100 | #325 | Tragic 3.11 |
| Ottawa | 0.0 /100 | #326 | Tragic 3.11 |
| Dutch | 0.0 /100 | #327 | Tragic 3.11 |
| Czechs | 0.0 /100 | #328 | Tragic 3.11 |
| Belgians | 0.0 /100 | #329 | Tragic 3.11 |
| Latvians | 0.0 /100 | #330 | Tragic 3.11 |
| Scotch-Irish | 0.0 /100 | #331 | Tragic 3.11 |
Demographics Similar to Canadians by Average Family Size
In terms of average family size, the demographic groups most similar to Canadians are Immigrants from Sweden (3.14, a difference of 0.010%), Austrian (3.14, a difference of 0.050%), Ukrainian (3.14, a difference of 0.050%), Immigrants from Western Europe (3.14, a difference of 0.050%), and Colville (3.14, a difference of 0.050%).
| Demographics | Rating | Rank | Average Family Size |
| Europeans | 0.2 /100 | #292 | Tragic 3.14 |
| Scandinavians | 0.2 /100 | #293 | Tragic 3.14 |
| Immigrants | Croatia | 0.2 /100 | #294 | Tragic 3.14 |
| Austrians | 0.2 /100 | #295 | Tragic 3.14 |
| Ukrainians | 0.2 /100 | #296 | Tragic 3.14 |
| Immigrants | Western Europe | 0.2 /100 | #297 | Tragic 3.14 |
| Colville | 0.2 /100 | #298 | Tragic 3.14 |
| Canadians | 0.2 /100 | #299 | Tragic 3.14 |
| Immigrants | Sweden | 0.2 /100 | #300 | Tragic 3.14 |
| Macedonians | 0.2 /100 | #301 | Tragic 3.13 |
| Immigrants | Latvia | 0.2 /100 | #302 | Tragic 3.13 |
| British | 0.2 /100 | #303 | Tragic 3.13 |
| Immigrants | Switzerland | 0.2 /100 | #304 | Tragic 3.13 |
| Australians | 0.1 /100 | #305 | Tragic 3.13 |
| Immigrants | Ireland | 0.1 /100 | #306 | Tragic 3.13 |