Samoan vs Canadian In Labor Force | Age 20-64
COMPARE
Samoan
Canadian
In Labor Force | Age 20-64
In Labor Force | Age 20-64 Comparison
Samoans
Canadians
79.0%
IN LABOR FORCE | AGE 20-64
2.9/ 100
METRIC RATING
236th/ 347
METRIC RANK
79.1%
IN LABOR FORCE | AGE 20-64
6.8/ 100
METRIC RATING
223rd/ 347
METRIC RANK
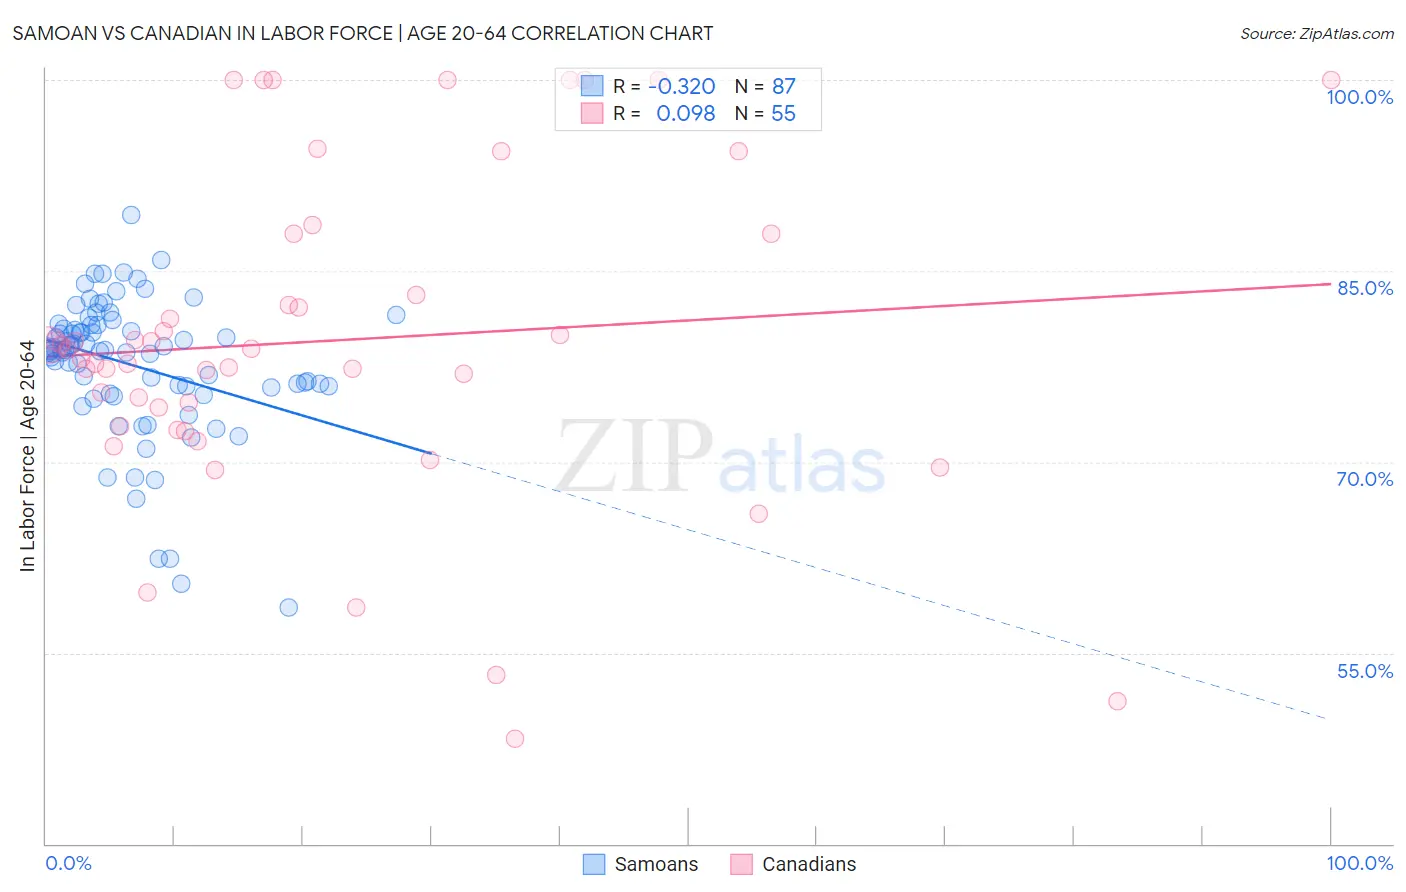
Samoan vs Canadian In Labor Force | Age 20-64 Correlation Chart
The statistical analysis conducted on geographies consisting of 225,189,054 people shows a mild negative correlation between the proportion of Samoans and labor force participation rate among population between the ages 20 and 64 in the United States with a correlation coefficient (R) of -0.320 and weighted average of 79.0%. Similarly, the statistical analysis conducted on geographies consisting of 437,567,192 people shows a slight positive correlation between the proportion of Canadians and labor force participation rate among population between the ages 20 and 64 in the United States with a correlation coefficient (R) of 0.098 and weighted average of 79.1%, a difference of 0.18%.
In Labor Force | Age 20-64 Correlation Summary
| Measurement | Samoan | Canadian |
| Minimum | 58.6% | 48.2% |
| Maximum | 89.4% | 100.0% |
| Range | 30.8% | 51.8% |
| Mean | 77.6% | 79.5% |
| Median | 78.8% | 78.8% |
| Interquartile 25% (IQ1) | 75.9% | 72.8% |
| Interquartile 75% (IQ3) | 80.7% | 87.9% |
| Interquartile Range (IQR) | 4.9% | 15.1% |
| Standard Deviation (Sample) | 5.5% | 12.5% |
| Standard Deviation (Population) | 5.5% | 12.4% |
Demographics Similar to Samoans and Canadians by In Labor Force | Age 20-64
In terms of in labor force | age 20-64, the demographic groups most similar to Samoans are Immigrants from North America (79.0%, a difference of 0.0%), Immigrants from Canada (79.0%, a difference of 0.020%), Tlingit-Haida (79.0%, a difference of 0.020%), Immigrants from Jamaica (79.0%, a difference of 0.030%), and Welsh (79.0%, a difference of 0.040%). Similarly, the demographic groups most similar to Canadians are Immigrants from Panama (79.1%, a difference of 0.0%), Immigrants from Uzbekistan (79.1%, a difference of 0.0%), Hungarian (79.2%, a difference of 0.010%), Portuguese (79.1%, a difference of 0.020%), and Immigrants (79.2%, a difference of 0.030%).
| Demographics | Rating | Rank | In Labor Force | Age 20-64 |
| French Canadians | 8.4 /100 | #219 | Tragic 79.2% |
| Immigrants | Immigrants | 7.7 /100 | #220 | Tragic 79.2% |
| Hungarians | 7.2 /100 | #221 | Tragic 79.2% |
| Immigrants | Panama | 6.9 /100 | #222 | Tragic 79.1% |
| Canadians | 6.8 /100 | #223 | Tragic 79.1% |
| Immigrants | Uzbekistan | 6.8 /100 | #224 | Tragic 79.1% |
| Portuguese | 6.4 /100 | #225 | Tragic 79.1% |
| Central Americans | 5.9 /100 | #226 | Tragic 79.1% |
| Immigrants | Western Europe | 5.9 /100 | #227 | Tragic 79.1% |
| Panamanians | 5.7 /100 | #228 | Tragic 79.1% |
| Alsatians | 5.7 /100 | #229 | Tragic 79.1% |
| Native Hawaiians | 5.6 /100 | #230 | Tragic 79.1% |
| Lebanese | 5.1 /100 | #231 | Tragic 79.1% |
| Guamanians/Chamorros | 4.5 /100 | #232 | Tragic 79.1% |
| Japanese | 4.0 /100 | #233 | Tragic 79.1% |
| Immigrants | Canada | 3.2 /100 | #234 | Tragic 79.0% |
| Tlingit-Haida | 3.2 /100 | #235 | Tragic 79.0% |
| Samoans | 2.9 /100 | #236 | Tragic 79.0% |
| Immigrants | North America | 2.9 /100 | #237 | Tragic 79.0% |
| Immigrants | Jamaica | 2.6 /100 | #238 | Tragic 79.0% |
| Welsh | 2.4 /100 | #239 | Tragic 79.0% |