Russian vs Immigrants from Cuba Single Mother Households
COMPARE
Russian
Immigrants from Cuba
Single Mother Households
Single Mother Households Comparison
Russians
Immigrants from Cuba
5.3%
SINGLE MOTHER HOUSEHOLDS
99.7/ 100
METRIC RATING
28th/ 347
METRIC RANK
7.5%
SINGLE MOTHER HOUSEHOLDS
0.1/ 100
METRIC RATING
270th/ 347
METRIC RANK
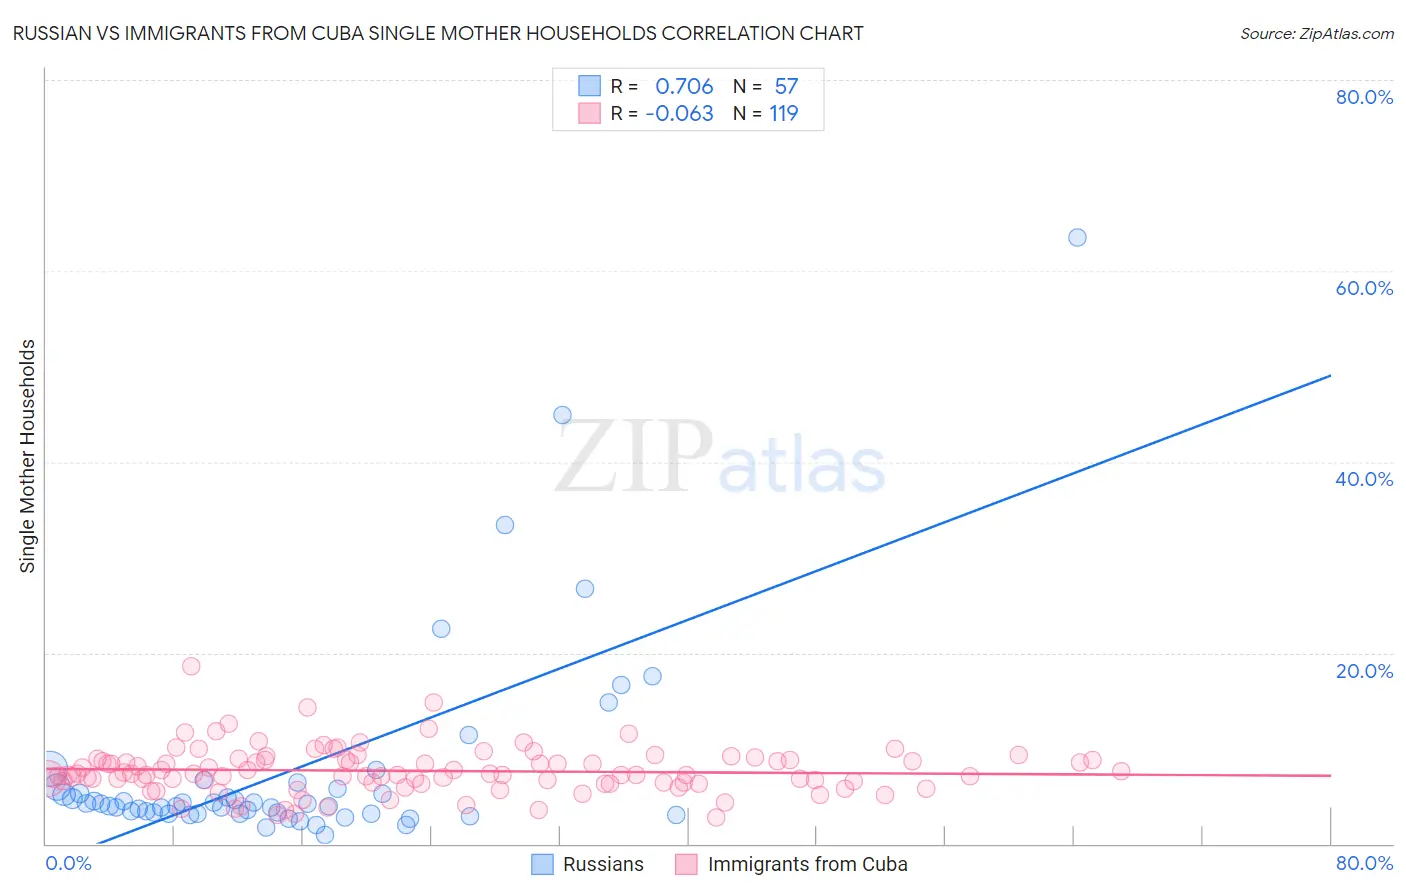
Russian vs Immigrants from Cuba Single Mother Households Correlation Chart
The statistical analysis conducted on geographies consisting of 509,106,631 people shows a strong positive correlation between the proportion of Russians and percentage of single mother households in the United States with a correlation coefficient (R) of 0.706 and weighted average of 5.3%. Similarly, the statistical analysis conducted on geographies consisting of 325,295,846 people shows a slight negative correlation between the proportion of Immigrants from Cuba and percentage of single mother households in the United States with a correlation coefficient (R) of -0.063 and weighted average of 7.5%, a difference of 42.5%.
Single Mother Households Correlation Summary
| Measurement | Russian | Immigrants from Cuba |
| Minimum | 0.89% | 2.7% |
| Maximum | 63.5% | 18.6% |
| Range | 62.6% | 15.9% |
| Mean | 7.8% | 7.6% |
| Median | 4.2% | 7.2% |
| Interquartile 25% (IQ1) | 3.2% | 6.4% |
| Interquartile 75% (IQ3) | 5.8% | 8.8% |
| Interquartile Range (IQR) | 2.6% | 2.4% |
| Standard Deviation (Sample) | 11.0% | 2.4% |
| Standard Deviation (Population) | 10.9% | 2.4% |
Similar Demographics by Single Mother Households
Demographics Similar to Russians by Single Mother Households
In terms of single mother households, the demographic groups most similar to Russians are Latvian (5.3%, a difference of 0.010%), Burmese (5.3%, a difference of 0.080%), Immigrants from Korea (5.3%, a difference of 0.080%), Cambodian (5.3%, a difference of 0.090%), and Bhutanese (5.3%, a difference of 0.10%).
| Demographics | Rating | Rank | Single Mother Households |
| Eastern Europeans | 99.8 /100 | #21 | Exceptional 5.2% |
| Thais | 99.8 /100 | #22 | Exceptional 5.2% |
| Immigrants | Austria | 99.8 /100 | #23 | Exceptional 5.2% |
| Armenians | 99.8 /100 | #24 | Exceptional 5.2% |
| Immigrants | Japan | 99.8 /100 | #25 | Exceptional 5.2% |
| Immigrants | Lithuania | 99.8 /100 | #26 | Exceptional 5.3% |
| Bhutanese | 99.7 /100 | #27 | Exceptional 5.3% |
| Russians | 99.7 /100 | #28 | Exceptional 5.3% |
| Latvians | 99.7 /100 | #29 | Exceptional 5.3% |
| Burmese | 99.7 /100 | #30 | Exceptional 5.3% |
| Immigrants | Korea | 99.7 /100 | #31 | Exceptional 5.3% |
| Cambodians | 99.7 /100 | #32 | Exceptional 5.3% |
| Immigrants | Switzerland | 99.7 /100 | #33 | Exceptional 5.3% |
| Bulgarians | 99.7 /100 | #34 | Exceptional 5.3% |
| Immigrants | Northern Europe | 99.7 /100 | #35 | Exceptional 5.3% |
Demographics Similar to Immigrants from Cuba by Single Mother Households
In terms of single mother households, the demographic groups most similar to Immigrants from Cuba are Salvadoran (7.5%, a difference of 0.090%), Immigrants from the Azores (7.5%, a difference of 0.090%), Somali (7.5%, a difference of 0.16%), Belizean (7.6%, a difference of 0.40%), and Immigrants from Guyana (7.6%, a difference of 0.45%).
| Demographics | Rating | Rank | Single Mother Households |
| Immigrants | Nicaragua | 0.2 /100 | #263 | Tragic 7.4% |
| Yaqui | 0.1 /100 | #264 | Tragic 7.4% |
| Crow | 0.1 /100 | #265 | Tragic 7.4% |
| Nepalese | 0.1 /100 | #266 | Tragic 7.5% |
| Blackfeet | 0.1 /100 | #267 | Tragic 7.5% |
| Indonesians | 0.1 /100 | #268 | Tragic 7.5% |
| Somalis | 0.1 /100 | #269 | Tragic 7.5% |
| Immigrants | Cuba | 0.1 /100 | #270 | Tragic 7.5% |
| Salvadorans | 0.1 /100 | #271 | Tragic 7.5% |
| Immigrants | Azores | 0.1 /100 | #272 | Tragic 7.5% |
| Belizeans | 0.1 /100 | #273 | Tragic 7.6% |
| Immigrants | Guyana | 0.1 /100 | #274 | Tragic 7.6% |
| Central American Indians | 0.1 /100 | #275 | Tragic 7.6% |
| Guyanese | 0.1 /100 | #276 | Tragic 7.6% |
| Immigrants | Trinidad and Tobago | 0.1 /100 | #277 | Tragic 7.6% |